
Gold prices fell significantly yesterday, dropping from a 4 month high. However, what is interesting is the fact that prices fell without any potential stimulant. Risk appetite was bearish during the European session when the sell-off started, and US stocks were also under pressure despite trading mostly flat as a whole. Thus, according to the classic correlation we should be seeing Gold prices trading higher and not lower due to risk aversion.
Nonetheless, price did react in a reasonable manner when the stronger-than-expected New Home Sales numbers were released - with Gold prices falling to a low of 1,322.6 after New Home Sales unexpectedly grew 9.6% M/M versus analyst consensus estimate of a 3.4% pullback. Hence it is not true that Gold prices are immune to risk trends, but rather there is strong bearish sentiment that is allowing market to ignore risk trends and overreact when news announcement are favourable to the downside.
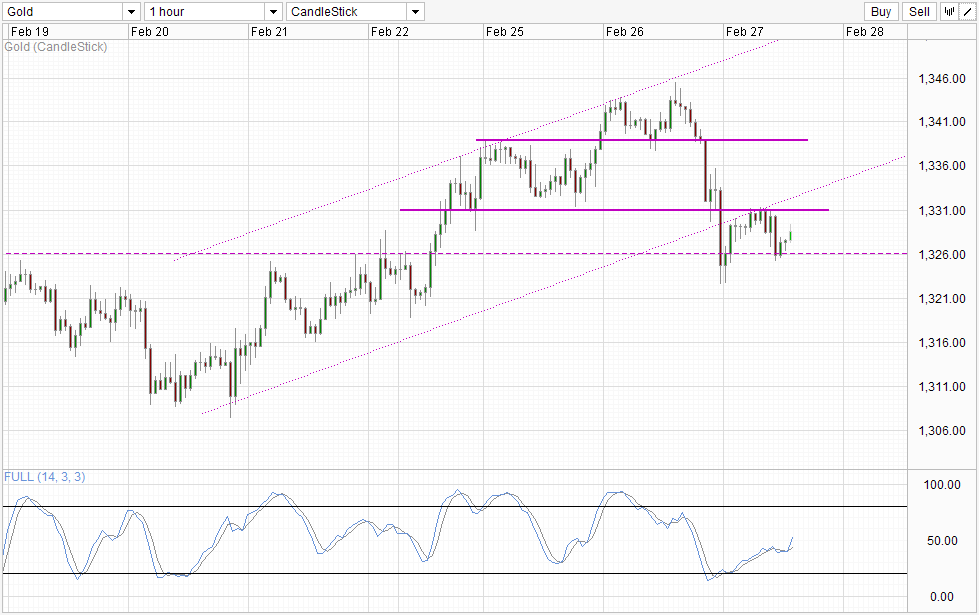
Hourly Chart
 XAU/USD Hourly" title="XAU/USD Hourly" height="242" width="474">
That being said, it is worth noting that this bearish sentiment isn't exactly the strongest either as prices did not manage to break 1,326 soft support but instead traded higher towards 1,331 resistance towards the end of US session. This rebound coincided with US stocks trading lower, suggesting that the strength of bearish sentiment may not be enough to ignore risk trends for an extended period of time.
Some may argue that it is not risk trends that is resulting in prices rebounding up higher but rather it is bullish technical pressure pure and simple. But if that is true, then the likelihood of 1,326 breaking does not improve and may in fact worsen as the 2nd test of 1,326 support is even weaker than the original dip - a sign that bulls are resilient and may even be turning the tide.
As such, no matter which way you cut it, the likelihood of a short-term move towards 1,331 support turned resistance is high. Stochastic readings agree with Stoch curve currently halfway within the bullish cycle. Mid-term bullish prospect for Gold may be more suspect as Stochastic readings most likely may be Overbought when price hits around 1,331, while Channel Bottom may add further bearish pressure.
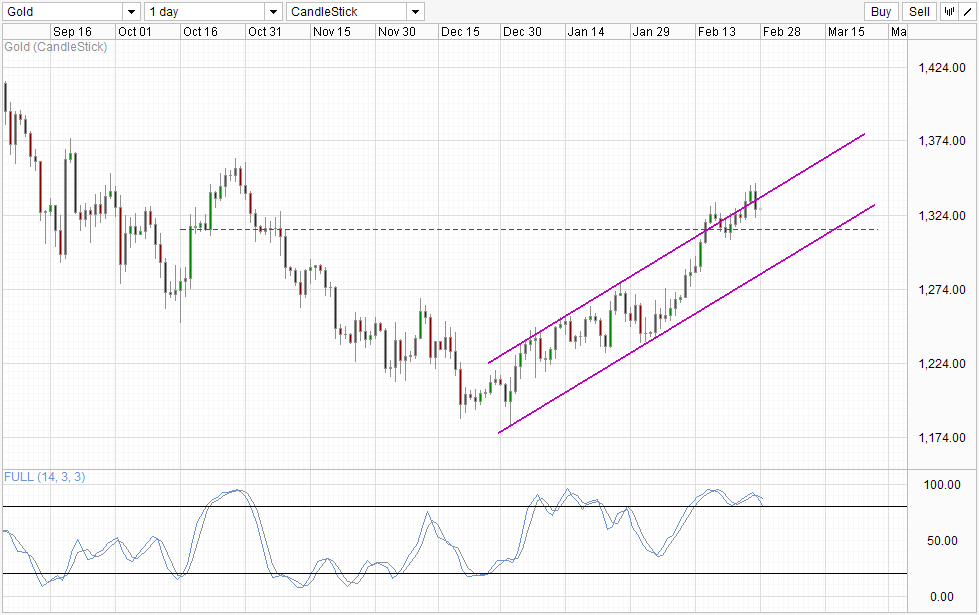
Daily Chart
 XAU/USD Hourly" title="XAU/USD Hourly" height="242" width="474">
Price direction on the Daily Chart is mixed. On one hand there are strong bearish signs with prices breaking back within the rising Channel while Stochastic is threatening to open up a bearish cycle signal - suggesting that a move towards Channel Bottom is possible. On the other we have prices trading above the 1,326 level which has been acting as a ceiling for the consolidation zone seen between 17th Feb and 24th Feb. This implies that the uptrend that we've seen since the start of 2014 may still be in play.