Why could September be fateful for the precious-metals complex? First, consider its history within the current secular bull market. The years 2005, 2007, 2009 and 2010 have seen very important breakouts in either or both Gold and gold stocks in the month of September. Conversely, September marked important peaks in 2008 as well as in each of the past three years. Currently, Gold and more so the gold miners are consolidating their recent gains just below very important resistance. This consolidation figures to end before the end of September which means September will produce another important inflection point.
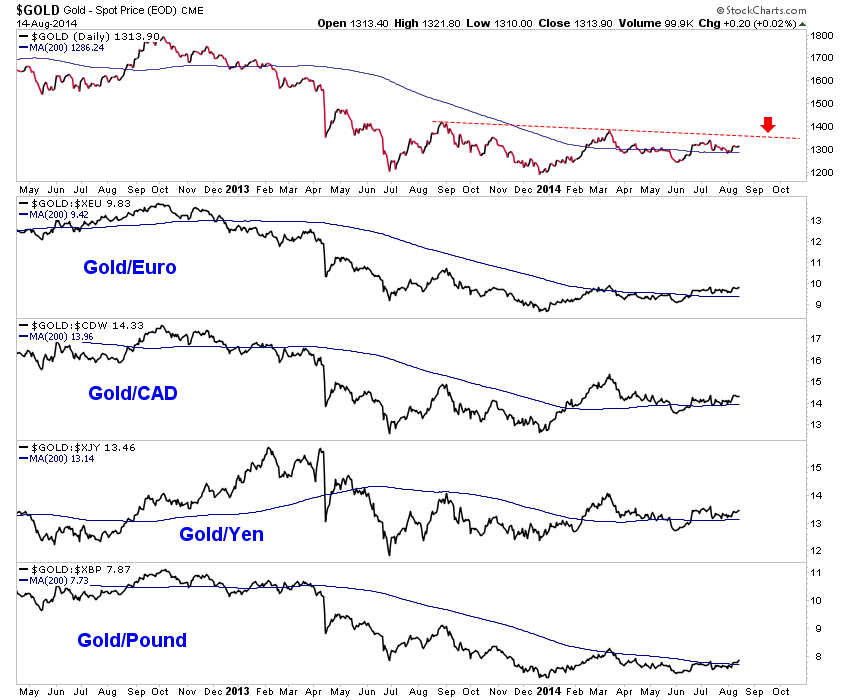
Last week we noted that Gold has started to show strength against the stock market, commodities and notably foreign currencies. Bears expected Gold to decline below $1280 due to the rally in the greenback. Instead, Gold stabilized in part because of foreign buying. The following chart plots Gold and then Gold priced against the major currencies. The 200-day moving average is shown. Every plot is trading above its 200-day moving average.

Take a careful look at these charts and you will notice how the character of the market has changed. These charts show the April 2013 crash followed by a decline to a new low. That final low was retested at the tail end of 2013. In every chart Gold had a strong rally to start 2014 and after a correction has worked its way back above its 200-day moving average which is no longer sloping down. The action of the past month has been critical. Gold kept its higher low intact and remained above its 200-day moving average.
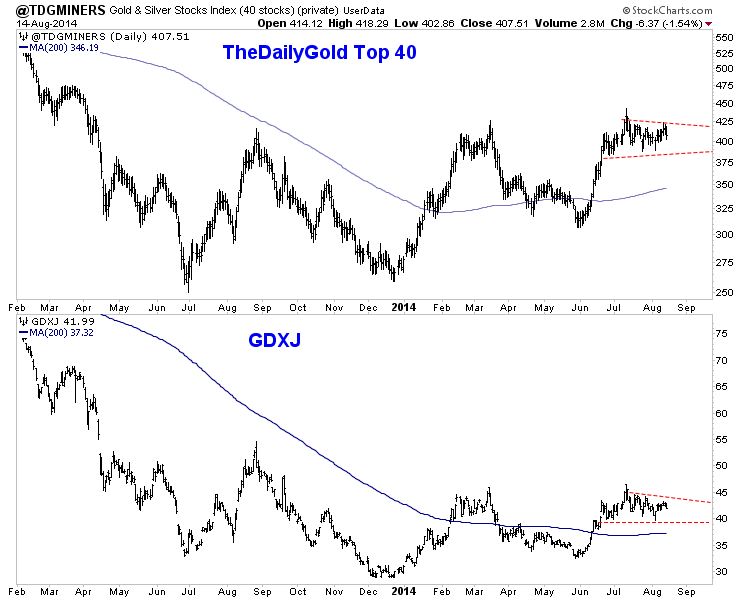
The action in the stocks should prove more telling as they have led this bottoming process and remained well above their 200-day moving averages. We plot our Top 40 index with Market Vectors Junior Gold Miners (ARCA:GDXJ) in the chart below. Both indices remain entrenched in a consolidation. After Thursday’s decline the bias over the coming days could be down.

There is also an obvious change of character in the trading of the miners. First, compare the recent peak to the previous peaks (March 2014 and August 2013). At both peaks GDXJ shed 20% within 10 trading days. GDXJ and the top 40 have consolidated for over one month yet haven’t declined more than 10%. In addition, the 200-day moving averages, which were sloping down and resistance in 2013 are now sloping up slightly and figure to provide support if need be.
As I indicated last week, we are positioned for a breakout. My only concern has been the weakness in Gold. However, it held $1280 and is showing increasing relative strength against currencies, equities and commodities. Meanwhile, the miners have remained in a tight consolidation for weeks. They are digesting huge gains in a bullish fashion. If this breakout occurs in September then it truly will be Old Turkey time. Then the key for us speculators and investors will be company selection much more so than trading.
