Mark Twain said history doesn’t repeat itself but it rhymes. We often see that in the capital markets. The big decline in Gold this year is reminiscent of that of 1975-1976. Yet, aside from that there are several other similarities between today and 1976. Gold, gold stocks, the stock market and commodities appear to be in a similar position today compared to 1976.
1. decline in gold stocks
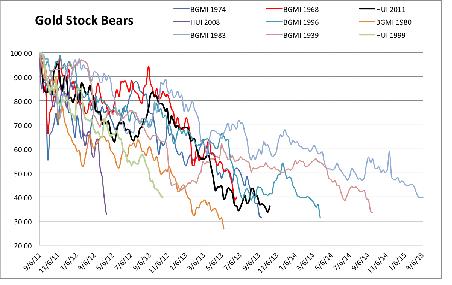
From 1974 to 1976 the Barron’s Gold Mining Index declined 67%. From 2011 to 2013, the HUI Gold Bugs Index declined 66%. The chart below is an updated chart of all of the worst cyclical bear markets in gold stocks, dating back to 1938.

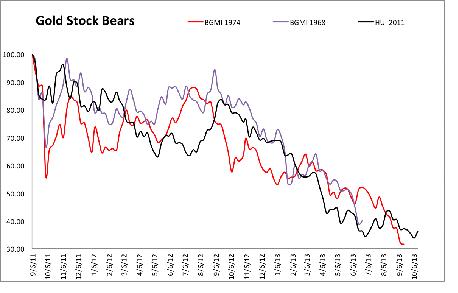
The next shows three of the four major cyclical bear markets which occurred within secular bull markets. (The 2008 bear is omitted). Look at how close the current bear is to the 1974-1976 bear? They are nearly identical in terms of price and time. It’s also not far off from the other bear.

2. gold stocks vs. S&P 500
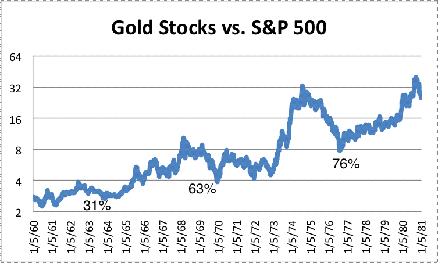
While gold stocks experienced a 67% decline from 1974 to 1976, the stock market recovered strongly from the 1973-1974 recession. The chart below (rebalanced) shows the Barron’s Gold Mining Index against the S&P 500. The ratio declined 76% from 1974 to 1976.

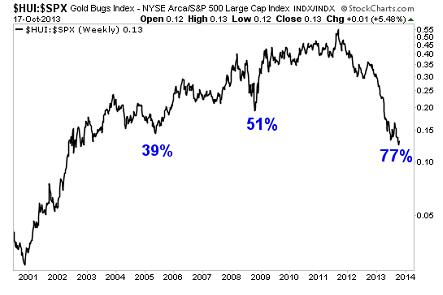
Just like from 1974 to 1976, the gold stocks from 2011-2013, when measured against the S&P 500, have declined 77%.

By Jordan Roy-Byrne
1. decline in gold stocks
From 1974 to 1976 the Barron’s Gold Mining Index declined 67%. From 2011 to 2013, the HUI Gold Bugs Index declined 66%. The chart below is an updated chart of all of the worst cyclical bear markets in gold stocks, dating back to 1938.

The next shows three of the four major cyclical bear markets which occurred within secular bull markets. (The 2008 bear is omitted). Look at how close the current bear is to the 1974-1976 bear? They are nearly identical in terms of price and time. It’s also not far off from the other bear.

2. gold stocks vs. S&P 500
While gold stocks experienced a 67% decline from 1974 to 1976, the stock market recovered strongly from the 1973-1974 recession. The chart below (rebalanced) shows the Barron’s Gold Mining Index against the S&P 500. The ratio declined 76% from 1974 to 1976.

Just like from 1974 to 1976, the gold stocks from 2011-2013, when measured against the S&P 500, have declined 77%.

By Jordan Roy-Byrne
