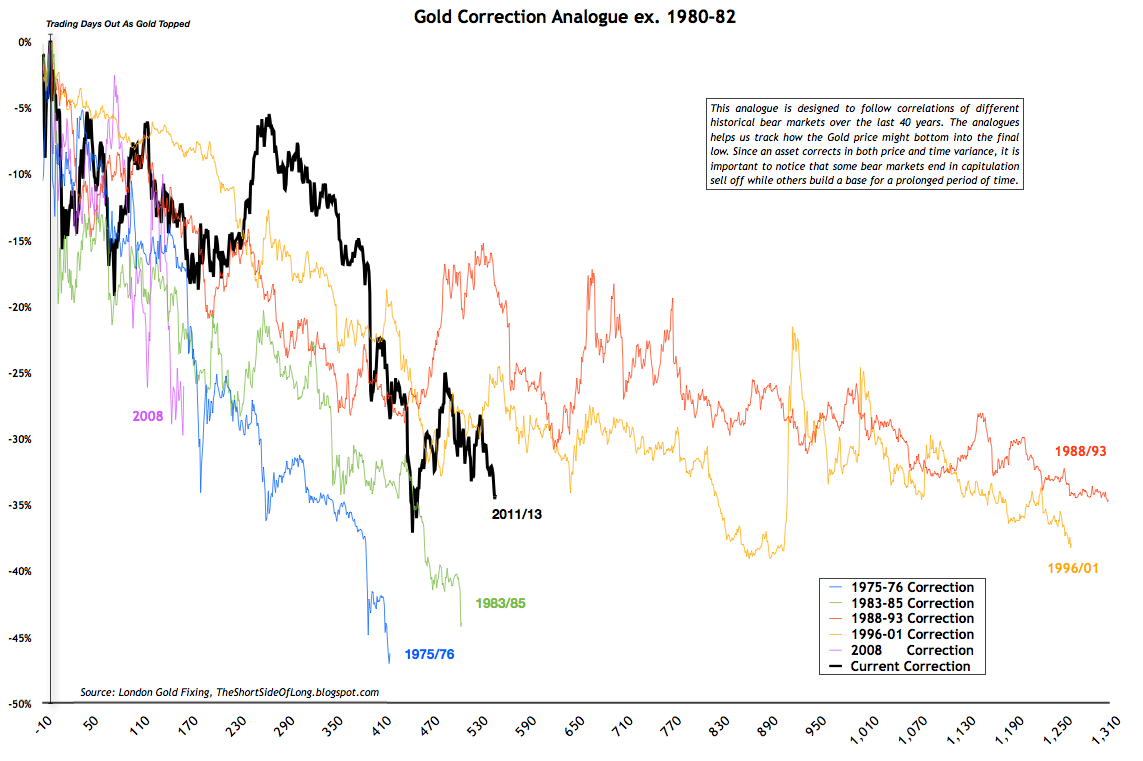
The current Gold correction is the worst in over a decade, but that is understandable since Gold had a stellar run-up of 12 annual gains in the row (very rare for any asset class, but it does happen from time to time). While 2008 sell off was a strong pullback, Gold managed to make those losses back, finishing 2008 with a gain as well. Quite a remarkable trend momentum (something similar to the current conditions in the S&P). Therefore, a correction and a proper bear market was to be expected and we are now going through it.
Chart 1: Historical Gold price corrections since the 1970s
The peak finally came in September 2011, over two years ago, at the price above $1,900 per ounce. Since then, the price of Gold has been in a downtrend for over 550 trading days and down almost 40% (as of late June). So how does this compare to Gold's other bear markets? Let us make a few observations, by focusing on the chart above:
- The 2011-13 sell off is very similar to the 1988, 1996 and 2008 bear markets in percentage losses, however 2008 was very sharp and quick, while 1988 and 1996 were tremendously long
- The 1975-76 and 1983-85 sell offs were very similar to the current 2011-13 bear market in time consolidation, however both of those bear markets were much more oversold nearing 45% drawdowns
- The 1980-82 bear market is excluded in the chart above, for the basic reason that Gold became extremely overvalued in late 1970s as it spiked up in a super parabolic bubble (and more than 100% above 200 MA), similar to Nasdaq in '00
Click here for the chart including the infamous 1980-82 sell off. I will also post the Silver correction analogue chart sometime in the future. Stay tuned!
