Preface: Explaining our market timing models
We maintain several market timing models, each with differing time horizons. The "Ultimate Market Timing Model" is a long-term market timing model based on the research outlined in our post, Building the ultimate market timing model. This model tends to generate only a handful of signals each decade.
The Trend Model is an asset allocation model which applies trend following principles based on the inputs of global stock and commodity price. This model has a shorter time horizon and tends to turn over about 4-6 times a year. In essence, it seeks to answer the question, "Is the trend in the global economy expansion (bullish) or contraction (bearish)?"
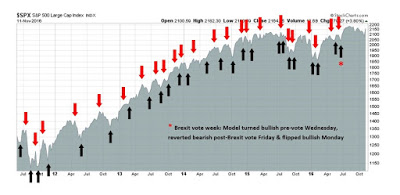
My inner trader uses the trading component of the Trend Model to look for changes in direction of the main Trend Model signal. A bullish Trend Model signal that gets less bullish is a trading "sell" signal. Conversely, a bearish Trend Model signal that gets less bearish is a trading "buy" signal. The history of actual out-of-sample (not backtested) signals of the trading model are shown by the arrows in the chart below. Past trading of the trading model has shown turnover rates of about 200% per month.
The latest signals of each model are as follows:
- Ultimate market timing model: Buy equities*
- Trend Model signal: Risk-on*
- Trading model: Bullish*
The performance chart and model readings have been delayed by a week out of respect to our paying subscribers.
Dark clouds on the horizon
Regular readers know that I have been bullish on stocks for much of this year, but I am now going on "recession watch". Josh Brown agrees. He tweeted the following last Thursday:
While Brown may have gone on "recession watch" for contrarian reasons, I am on "recession watch" because of a deterioration in macro data. But don't panic. A "recession watch" is emphatically not a forecast of an impending slowdown, nor is it a forecast of an imminent bear market. Macro readings are starting to look a little wobbly and therefore some caution may be warranted. The scenario that I outlined before of a cyclical top in 2017 is playing itself out (see Roadmap to a 2017 market top).
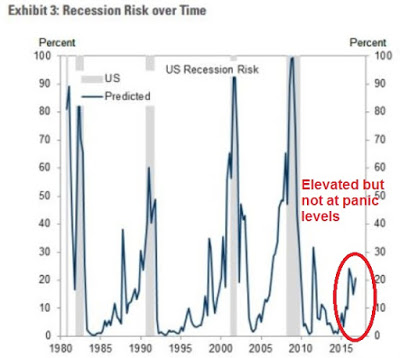
The chart below shows Goldman Sachs' depiction of US recession risk. While I don`t necessarily agree with Goldman`s probability estimates, I do agree that risks are rising but they are not at levels that warrant a full-scale defensive portfolio position (annotations in red are mine).
This week, I would like to expand on the threats that faces the US and global economies, and by implication the stock market. I would further point out that the data began to deteriorate before the election and my change in view has little to do with the electoral results. Only one of the Trump proposals have an unexpected side-effect of exacerbating the downside vulnerability of the global economy in a downturn, but that effect is relatively minor.
DISCLAIMER: Cam Hui is a portfolio manager at Qwest Investment Fund Management Ltd. (""Qwest""). This article is prepared by Mr. Hui as an outside business activity. As such, Qwest does not review or approve materials presented herein. The opinions and any recommendations expressed in this blog are those of the author and do not reflect the opinions or recommendations of Qwest.
None of the information or opinions expressed in this blog constitutes a solicitation for the purchase or sale of any security or other instrument. Nothing in this article constitutes investment advice and any recommendations that June be contained herein have not been based upon a consideration of the investment objectives, financial situation or particular needs of any specific recipient. Any purchase or sale activity in any securities or other instrument should be based upon your own analysis and conclusions. Past performance is not indicative of future results. Either Qwest or Mr. Hui June hold or control long or short positions in the securities or instruments mentioned."


