GNC Holdings Inc (NYSE:GNC)
Chances are even if you are not a major health and fitness enthusiast, you have passed by or noticed a GNC. Perhaps you even entered one to see just exactly what they sell, or you are the guy/gal who make it a regular stop for your supplies of health products or “healthier” food products and vitamins and supplements.
They are usually contained within strip malls,but depending on where you reside, they can be stand alone moderate-sized locations. The company went public in the 1980s- having been formed and family owned operating under the name General Nutrition Center by a man named David Shakarian from Pittsburg Pennsylvania.
After his death in 1984 the family decided to put the company up for sale, it went back to being a private company, then once again emerged as a public company in the late 1980’s. Since then it has gone private again and most recently went public in 2011. Quite a bit of ownership turnover.
This can probably be attributed to the fact that the health and fitness products industry is a highly competitive one with limited barriers to entry. This is speaking from a retail sense only, as the product must be manufactured under the strictest sanity guidelines according to the FDA.
Some of the homeopathic and natural remedy products can sometimes circumvent this scrutiny depending on the ingredients, methods of production and independent State statutes that govern them.
The Facts and Figures
Shares of GNC Holdings have traded in a 52-week range from a high of $35.90 to a low of $6.51. Shares were off roughly 81% in the previous 52 weeks. The company has a huge short float interest hanging roughly at 42%. It is this kind of a short float that can lead to massive moves higher in a stock price.
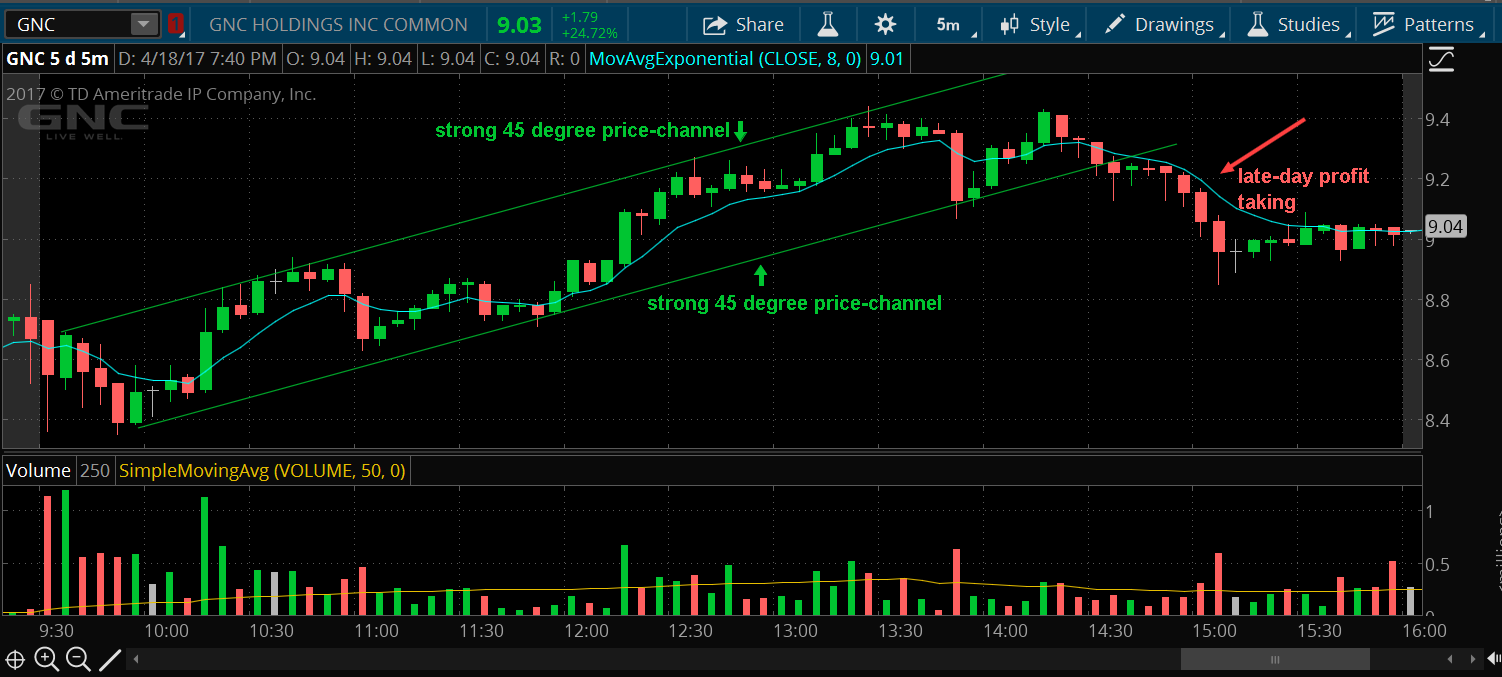
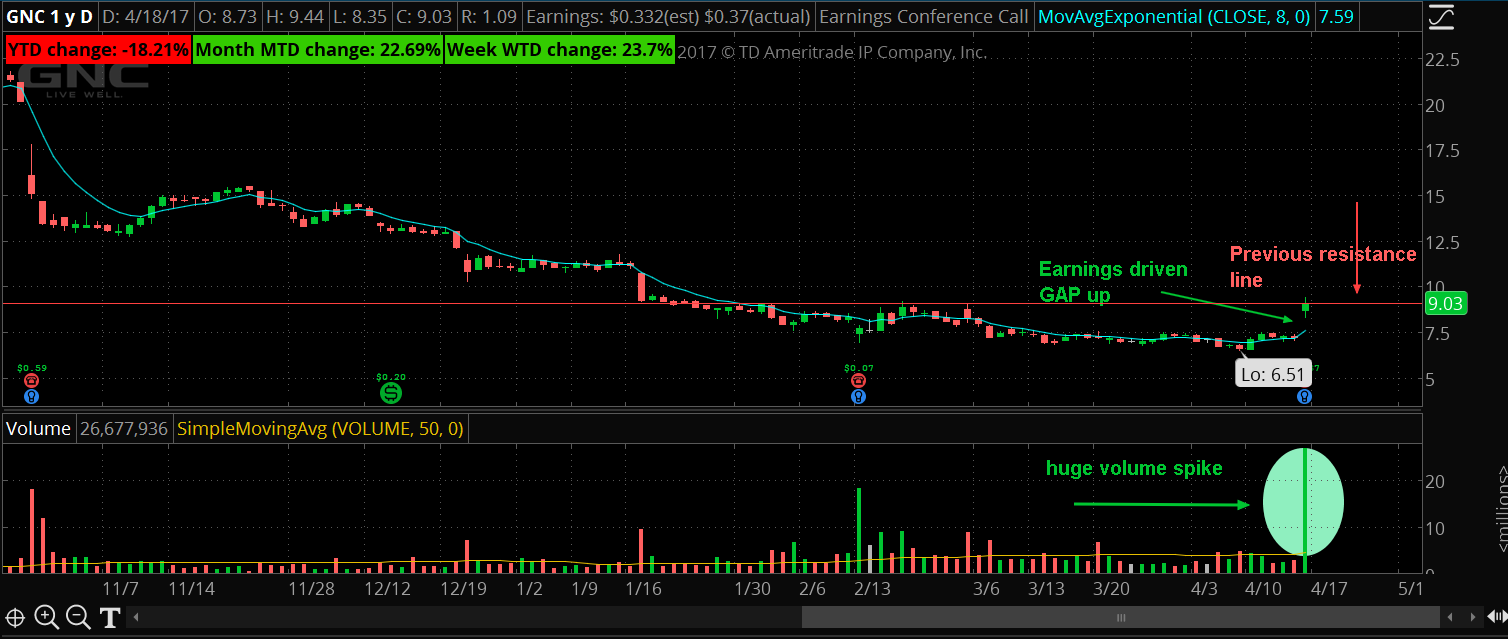
Earnings came in at $0.37 per share which beat the consensus of roughly $0.34 per share. Revenues were $644 million- slightly down from $668 million a year ago- and this also beat estimates. Shares gapped up at the opening of trading and stayed in a 45 degree uptrending trend-channel until late in the day when some profit takers decided to sell. This made the shares break the channel slightly, still closing up 24% at $9.03.
The Chart

You will note in the above five minute intra-day chart the price channel. It is this type of 45 degree angle which suggests constant buying and accumulating by investors and mutual funds. 45 degrees is considered by many market technicians and technical analysts as a strong and sustainable price trend that can continue as it doesn’t seem to go to extremes in either direction up or down.

In the above daily chart you can see the red previous resistance line and the price at which GNC gapped up to and where it closed. Note the oval shaded area below which has the volume bar. This volume bar shows it traded the most amount of volume since early November of 2016. Surely this gained many market participant’s attention and we will watch how it trades in the following days and weeks to come.
Company Comments
On the conference call CFO Tricia Tolivar had this to say-
“Last quarter, we had a 49% decline in [online] sales as we better aligned online and in-store pricing and promotions,”
“The consumer shopping on Amazon (NASDAQ:AMZN) is looking for GNC and those products have very high margins, so we’re able to leverage that on the storefront with Amazon.”
Robert Moran, the interim chief executive for the company, said the buy-one-get-one deals “drove higher average ticket,” but potentially led to “pantry loading.”
Company Profile
GNC Holdings, Inc. is a specialty retailer of health, wellness and performance products, which include protein, performance supplements, weight management supplements, vitamins, herbs and greens, wellness supplements, health and beauty, food and drink and other general merchandise.
The Company’s operations consist of purchasing raw materials, formulating and manufacturing products and selling the finished products. It operates in three segments: U.S. and Canada, International and Manufacturing/Wholesale. Its U.S. and Canada segment generates revenues primarily from sales of products to customers at its Company-owned stores in the United States, Canada and Puerto Rico, through its Websites, GNC.com and LuckyVitamin.com.
Its International segment generates revenue primarily to its international franchisees. Its Manufacturing/Wholesale segment comprises its manufacturing operations in South Carolina and its wholesale partner relationships.
