The global economy is running on all six cylinders. It may not be a global synchronized boom, but it is the most synchronized expansion of economic activity that the global economy has had since the recovery from the 2008/2009 recession. The direction of change can be seen in the titles of the past four issues of the International Monetary Fund’s World Economic Outlook: “Subdued Demand: Symptoms and Remedies” (Oct. 2016), “A Shifting Global Economic Landscape” (Jan. 2017), “Gaining Momentum?” (Apr. 2017), and “A Firming Recovery” (Jul. 2017).
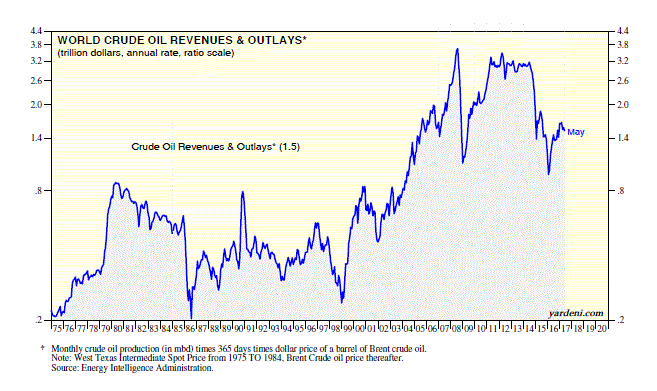
Why is this happening now? The global synchronized expansion may be attributable to the plunge in the price of a barrel of Brent crude oil from a 2014 peak of $115.06 on June 19 to a low of $27.88 on January 20, 2016 followed by the recovery to $52.75 last week. Over this same period, Debbie and I calculate that global crude oil revenues dropped from an annualized $3.2 trillion during June 2014 to $952 billion in early 2016, back to $1.5 trillion currently.
The initial freefall in revenues depressed the global energy industry, which slashed capital spending rapidly around the world. The rebound in oil revenues has given a lift to this industry, but surely not enough to explain the global synchronized expansion. The flip side of crude oil revenues is outlays by users of crude oil. The drop in the cost to users of oil is like a 50% cut in the global “oil tax” on consumers. Now that the downside of the energy price shock is over, the benefits to the global economy are rising to the surface of the barrel. Let’s review some of the recent more buoyant global data:
(1) GDP and profits. The growth rate in real GDP was revised higher last week, from 2.6% to 3.0% (saar) for Q2. On a y/y basis, real GDP was up 2.2%. It has been fluctuating around 2.0% since mid-2010.
(2) Europe. The Eurozone’s Economic Sentiment Index rose to 111.9 during August, the highest since July 2007. It is highly correlated with the region’s real GDP growth rate on a y/y basis, which was 2.2% during Q2, the best pace since Q1-2011. The Eurozone’s M-PMI rose to 57.4 last month, matching June’s reading, which was the highest since April 2011.
(3) China. China’s official M-PMI edged up to 51.7 during August, the 11th consecutive reading above 51.0. However, its NM-PMI declined from 54.5 during July to a 15-month low of 53.4 last month.
(4) Japan. Japan’s real GDP rose 4.0% (saar) during Q2, the fastest such pace since Q1-2015.
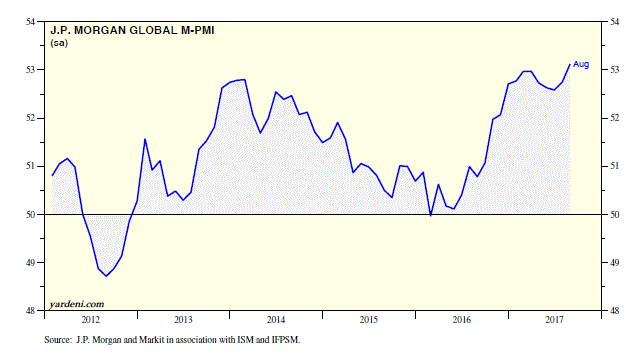
(5) Global manufacturing. Last month, the global M-PMI rose to 53.1, the highest since May 2011. Solid increases were registered for both the developed economies and the emerging ones.


