U.S. stocks are looking expensive by just about any metric you want to use: The trailing P/E, forward P/E, price/sales ratio, and total market cap / GDP ratio are all well above historical averages. Any way you slice it, U.S. stocks aren’t cheap. Today we’re going to look at stock values around the world and see what those values say about future returns.
I noted at the beginning of this year that U.S. stock values were sitting at a cyclically-adjusted price/earnings ratio (“CAPE”) of over 27 and that this implied we’d be looking at flattish returns of just 0.3% per year over the next eight years.
That estimate, made by research site GuruFocus, was based on three components: current dividend yield, expected economic growth over the next eight years and stock values as measured by the CAPE returning to their long-term average. Like any forecast, the model is only as good as its inputs, and a lot can happen over the next eight years. Stocks could remain above their long-term CAPE valuations if bond yields remain in the gutter, or the economy could end up growing at a much faster pace than expected. Stranger things have happened. But when allocating hard-earned capital, that’s not a bet I would want to make.
Today, we’re going to look at new CAPE data through January 31 from Swiss consultancy firm Wellershoff & Partners that compares stock values across all major world markets and forecasts returns over the next five years. Wellershoff’s methodology is a little different from that of GuruFocus. Wellershoff makes no assumptions about dividend yields or economic growth. Instead, they simply look at how the markets performed over the subsequent five years when priced at similar CAPE valuations in the past. (For the quants in the room, Wellershoff runs a regression analysis. If you want to dig into the numbers, they explain their methodology here.)
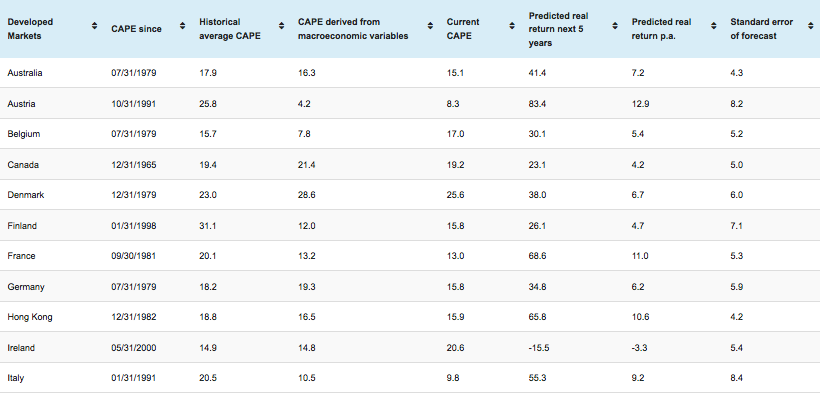
So, let’s take a look at their data for developed markets first:
Developed Markets


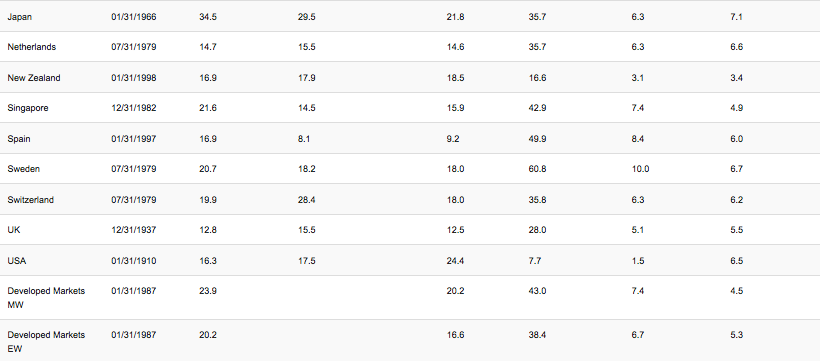
Most global stock values suggest solid, if not quite spectacular returns, over the next five years. A few exceptions jump off the page, however. Ireland is priced to actually lose 3.3% per year over the next five years and New Zealand is priced to deliver returns of only 3.1%. And by Wellershoff’s estimates, the U.S. is priced to deliver a skimpy 1.5% in annual returns.
But developed markets as a whole are priced to deliver returns of about 7% per year going forward. That’s not a “fat pitch” to swing at, but it’s not bad either, particularly given how unappealing bonds and cash are at current yields.
Let’s now see what emerging markets have to offer:
Emerging Market

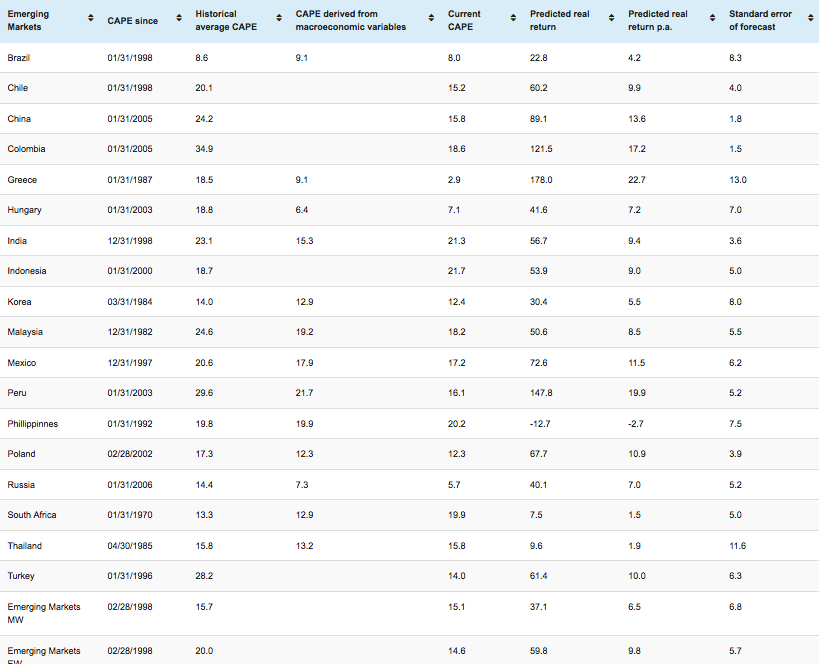
We need to view the emerging market data with a healthy grain of salt due to the shorter time horizons in question. For example, Peru’s (ARCA:EPU) historical data goes back only to 2003, a period that happened to coincide with a once-in-a-generation boom in mining. I wouldn’t consider Peru’s historical CAPE of 29.6 to be a realistic picture of Peruvian stock values. Likewise, Colombia (NYSE:ICOL) has an unrealistically high historical CAPE of 34.9, also due to a short time frame that happened to correspond to a period of unusually high growth..
That said, there are some attractive forecasts here. If you can handle the heartburn that would come with ownership, Greek stocks (NYSE:GREK) are priced to deliver killer returns of 22.7% per year for the next five years. Of course, you have to be confident that Greece won’t get kicked out of the Eurozone…and that risk is not something the historical figures reflect.
China (ARCA:FXI), Mexico (ARCA:EWW) and Turkey (ARCA:TUR) are also all priced to deliver solid double-digit annual returns. But interestingly, by Wellershoff estimates, Russian stock valuations (NYSE:RSX) suggest annual returns of just 7% going forward.
The usual caveats apply here: past performance is no guarantee of future results. And these forecasts are based on the past performance of these respective countries. Still, I would come away from this with one clear point: U.S. stocks are priced to deliver much lower returns than most other developed and emerging markets. To the extent you can, it makes sense to diversify and to overweight the cheaper, non-U.S. markets.
Charles Lewis Sizemore, CFA, is chief investment officer of the investment firm Sizemore Capital Management and the author of the Sizemore Insights blog
