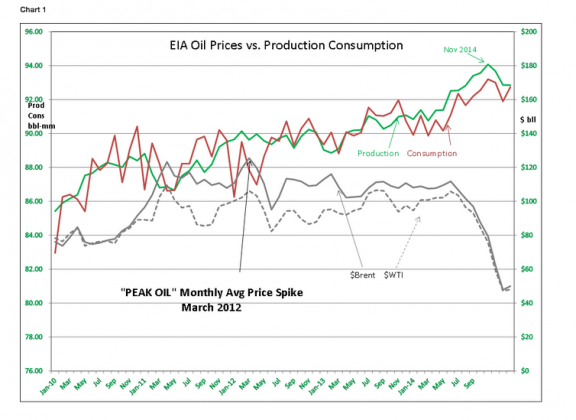
The EIA (US Energy Information Agency) reported global oil (OIL) (United States Oil Fund (NYSE:USO)) Production/Consumption. The data shows a rise in Consumption and a decline in Production. This should be no surprise to anyone. Even though prior month’s revisions show November 2014 as having peak Production (earlier reported as October 2014), within the range of revision, Supply/Demand is very much in balance-see Chart 1. How markets respond to this over the short term is anyone’s guess, but over the long term I fully expect a return to mid-$90s bbl pricing which is a level acceptable to producers and consumers not so long ago.

The media continues to highlight a ‘supply glut’ with some major investment firms suggesting that $20bbl oil for at least a year is a certainty. This completely ignores that the costs of operating wells at these levels would bankrupt quite a few companies with production costs in the $40bbl range and completely ignores that Russia and other oil based economies would be forced to cut as much as half of their government spending on services for their populations. Predictions for such dire outcomes is simply not what human beings do to themselves. You can already see that Production curtailment is occurring at less than $50bbl and that at current prices production will continue to fall thus supporting much higher prices.
If low price produces a negative result, it is normal to curtail production till prices justify production.
OPEC said again this week that Production/Consumption was mostly in balance with perhaps there being greater Consumption. They said the same when the market was panicking in Oct-Dec 2014, but either few listened or those who uttered a comment indicated they thought OPEC was manipulating the market. The EIA data makes it quite clear that OPEC has not suddenly pumped more oil as many have accused them of doing.
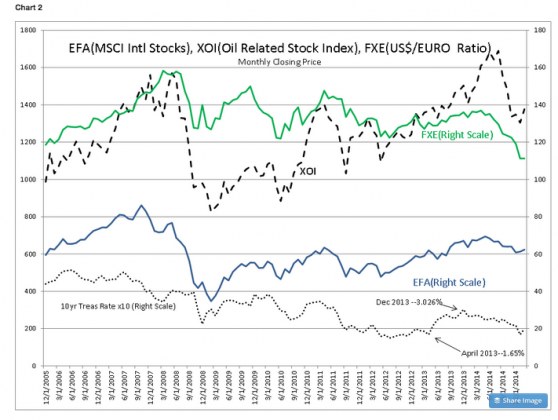
My opinion that the oil selloff was due to Hedge Funds reversing a ‘hyperinflation’ bet remains. This position which was reflected in media reports of 2010-2012 and the ‘Peak Oil’ scare at the time had a number of Hedge Fund managers long oil and other commodities and short the US$ and the 10yr Treasury. In fact, yields of the 10yr Treasury were rising as 2013 ended, rising from 1.65% in April 2013 and ending the year at 3.026%-see Chart 2 (The 10yr Treas rate is scaled by a factor of 10 so it fits in the chart 2 with the rest of the data). Simultaneously, oil and oil related issues as represented by XOI, Intl equities as represented by EFA and the relative value of the US$ was falling (relative to several currencies) vs. the euro which is shown by Rydex CurrencyShares Euro Currency (NYSE:FXE). You can see these trends clearly in Chart 2.

All the reasons for the ‘hyperinflation’ bet changed when turmoil began in Ukraine early Jan 2014 which forced out the pro-Russian government. Some call this a revolution against Russian control., This was followed rapidly by Russia taking over, 1st the Crimea in March and then 2nd attempting to take over Ukraine’s eastern sectors to create a land route to the Crimea. The net effect was a flood of Russian capital into the US forcing the 10yr Treasury rate(TNX) down to 2.5% by June 2014 or a change in yield of 17% in 6mos. To investors who were betting that the 10yr Treasury rate would rise, this was a very nasty surprise especially if 10 fold leverage levels were being employed.(10 fold using derivatives and margin is not unusual with currency leverage typically reported at 50 to 1) It has been variously reported that $70-$200Bil of capital exited Russia in the 1Q14 for Western nations. This capital flight began to exert a significant impact on Hedge Fund positions betting on the other direction. The 10yr Treasury rate fell to 1.65% in January 2015 as shorts were forced to cover positions.
Next to occur was the US$ which had weakened to $1.37/EURO(FXE) in April 2014 now began to strengthen hurting the ‘hyperinflation’ bet a little more. US$ strengthening would not end till FXE reached $1.1031/EURO in January 2015- see Chart 2. Shortly after the US$ began to strengthen, the EFA began to weaken in response. From its peak of 70.79 in June 2014, the EFA fell to 58.28 in January 2015 a nearly 20% decline- see Chart 2.
Last but not least, the most visible bet for future inflation, oil and oil related issues,(XOI) also peaked in June 2014 at 1730.19 falling to its low in December 2014 of 1211.24 or nearly a 30% decline as the ‘hyperinflation’ bet was unwound..-see Chart 2.
I think one can read the record of events and see that oil in excess was only the excuse provided by investors who had not tracked the details of events surrounding Russia’s actions and the previous positions taken in anticipation of inflation by highly levered investors in Hedge Funds. You could see from many media reports that a large ‘hyperinflation’ bet was in place and would have to be unwound if it proved incorrect. But, predicting when and how volatile this unwinding could be is not in anyone’s wheelhouse. What we could do though, if the volatility was severe enough, was to take advantage of it. This is in fact was what we did when we sold SmCaps at high levels and used the funds generated to buy more Intl LgCap and NatResource asset classes.
Thus far XOI is 12%+ above its December 2014 low and EFA is 7%+ above its January 2015 low. I expect this repositioning to work out to our favor the next several years. I think investors will come to see that oil and US$ should not have been priced to the extremes we just witnessed. Intl equities and NatResource assets should have a decent rebound.
Disclaimer: The information in this blog post represents my own opinions and does not contain a recommendation for any particular security or investment. I or my affiliates may hold positions or other interests in securities mentioned in the Blog, please see my Disclaimer page for my full disclaimer.