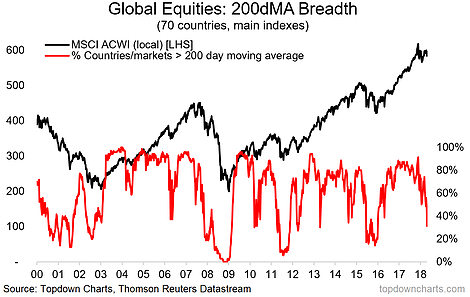
Here's a key standout chart from the latest Global Cross Asset Market Monitor (one of our weekly chart packs), it shows global equity market breadth. More to the point, it shows global equity market breadth completely breaking down.
For clarity, this metric is the proportion of countries/markets whose main equity benchmark is trading above its respective 200-day moving average. For the purposes of this analysis I track 70 countries. The reason why this is worth doing is that it can provide an early lead on potential troubles for global equities—as price often leads fundamentals.
Indeed, last week I highlighted 3 potential canaries in the coal mine for emerging markets and global equities in the global bear market meter. Certainly there seems to be a subtle shift in investor sentiment lately as the Trump trade war steps up, EM comes under stress, and Fed progressively tightens US (and global!) financial conditions...

