Bearish moods seemed to have permanently settled in energy markets. The first and most obvious victim of the nosediving oil prices has been natural gas.
Once seen invincible, liquefied natural gas (LNG) growth could now be racing to the edge of a cliff. Falling natural gas prices and fears about slowing demand in European and Asia all point to the return of a buyers’ market. Meanwhile, as crude prices fall, the oil-indexed European and Asian LNG contracts are plummeting in value, making upcoming LNG projects unsustainable. The pessimistic scenario seems to be reinforced by slumping demand in Asia, where the majority of new and existing LNG volumes were heading.
Last week Japan’s Kyushu Electric Power Company (TOKYO:9508) hooked its Sendai-1 nuclear power plant to the grid and expects to ramp up its generation to 95 percent in the following months. Other plants are soon to follow. Analysts predict that Japan could bring back to life 11.5 GW of nuclear generation capacity by 2017, cutting the natural gas demand by around 11 million tonnes of LNG, or 12 percent of the country’s gas imports.
Up until recently, Japan’s incredible demand for imported energy kept a floor beneath LNG prices. Japan imported a record 120 bcm of gas in 2014 or close to 36 percent of world’s total LNG exports. Not surprisingly JCC (Japanese Crude Cocktail) LNG oil-indexed prices remained above the $15/MMBtu mark for most of 2014.
However, the situation has changed dramatically since the winter of 2015. With Brent losing more than half of its value, gas prices in Asia have plummeted to around $8/MMBtu, or less than half of peak prices seen just a few years ago. The situation could get worse as Japan is expected to scale back imports, and China is seeing a fall in consumption signaled by this month’s decision by PetroChina to skip a planned LNG delivery and shift it for later during the winter season.
Additional worries about the Chinese economy are likely to depress prices further in 2015 and 2016 as the gap between European and Asian hub quotes narrow.
Bull Market Turns to Bust
The shale gas revolution upended gas markets because the U.S. no longer needed the previously projected gas imports, leaving new gas giants, including Qatar and Australia, scrambling to justify their multi-billion investments in costly LNG infrastructure. The supply glut drove prices down around the world.
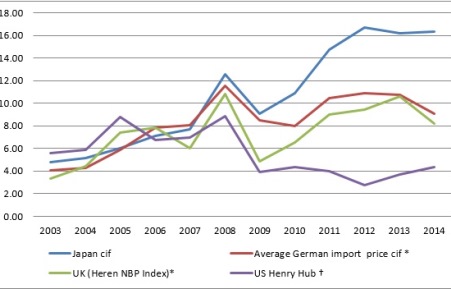
Source: BP (NYSE:BP)Statistical Review of World Energy, 2014
Then the Fukushima disaster happened and overnight the Japanese government rejected its decades-long strategy of energy diversification shutting down all of its nuclear reactors. Germany, fearing a populist backlash following the disaster, promised to phase out nuclear power by 2022. The emirs in Doha were over the moon. Gas demand in Japan jumped 20 percent over the next three years and LNG exporters rushed to fill the gap.
Meanwhile, the geopolitical instability in the Middle East and the Chinese appetite for energy pushed oil prices back above $100, driving up oil-indexed gas prices in Europe and Asia. This prompted another investment cycle in LNG capacity, which has turned out to be a rather premature step.
Already in 2009, there were visible signs that the gas future is not as bright as previously suspected. European gas demand began sliding very fast as energy efficiency regulations slashed household consumption and high oil-indexed prices charged by Russia among others motivated utilities to replace gas with cheaper U.S. coal that became uncompetitive in the U.S. market after the shale boom increased domestic gas output by 25 percent over the last 6 years.
Coupled with rising wind and solar capacity, backed by falling costs and state subsidies guaranteeing a high rate of return, the European gas sector is being gradually squeezed out.
Demand in Europe fell from a high of almost 500 bcm in 2008 to around 390 bcm last year. While gas imports are expected to rise over the next decade as European domestic production in the North Sea rapidly declines, overall consumed volumes could stagnate or even fall in the next five years.
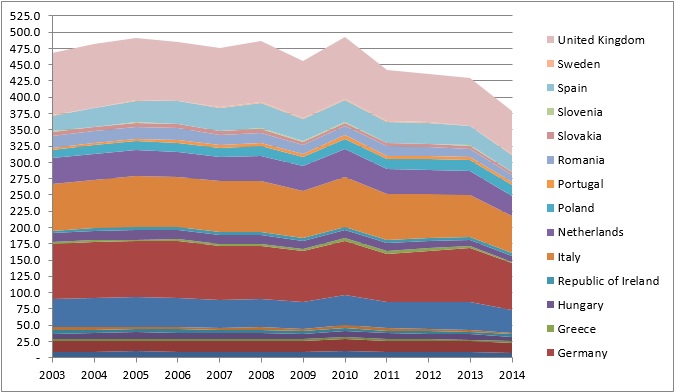
Source: BP Statistical Review of World Energy, Eurogas
To make matters worse, China’s slow-down could spell a lower gas demand growth over the next decade even as the economy is slowly embracing cleaner energy sources, which in part means replacing coal with gas. Although gas demand in the Middle Kingdom was rising by 16.5 percent from 2003 to 2014, the IEA predicts growth rates would decline to around 10 percent per annum until 2020.
Previously, LNG exporters expected that since China would require more and more gas imports to cover its growing economy, it would buy all the LNG coming out on the market by 2017 (circa 110 million tonnes). However, the truth is that China is trying to be as independent as possible from imported energy. According to the IEA, China would still satisfy more than half of its gas needs by domestic production in 2020, even more so if it pursues the development of its vast shale gas reserves, dubbed the largest in the world by the US Energy Information Administration (EIA).
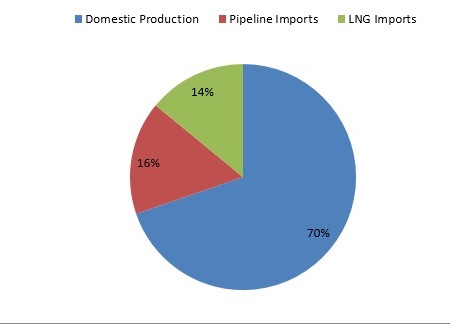
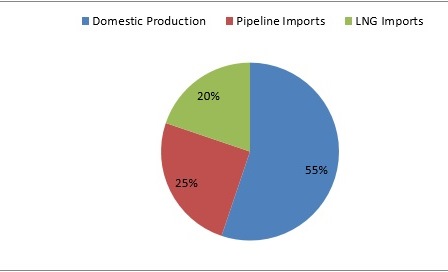
The IEA estimates that the share of LNG imports would rise by just 6 percentage points to around a fifth of the Chinese gas supply or 65 bcm in 2020 up from around 27 bcm today, even while total gas consumption would increase by more than 70 percent in the same period. Lower demand for LNG from second-largest economy in the world means that the gas glut could expand over the next five years as Qatar and Australia among others fight for market share.
LNG prices are bound to fall and the days of the oil indexation seem numbered. China is growing picky, and it will try to get a bargain from any gas deal it is making, as Russia can attest to after it agreed last year to sell gas to China at a lower rate than the price it sells to Europe. Moreover, the fact that China has as much as 20 million tonnes of regasification capacity sitting idle is a testament to the weakening prospects for LNG exporters.
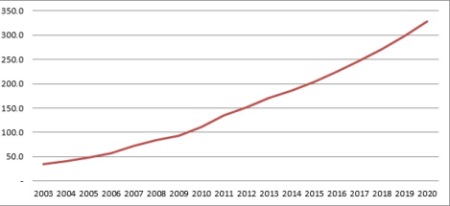
Source: IEA and BP
The hope for LNG exporters is that China reverses its strategy in the future as prices go down. With an expected 40.9 million tonnes of new regasification capacity planned to be built over the next few years – which could double the country’s import – China seems prepared to swallow all of the new LNG shipments set to come online. Everything will come down to how robust demand growth will be. A hard landing of the Chinese economy, combined with low gas prices could quickly make the vast new LNG trains in Australia, Africa and the U.S. unprofitable. Ultimately, this could lead to a yet another market tightening by the end of the decade as newcomers are driven out of the market.
Most ready to meet the double challenge of slowing demand and growing competition are Qatar and Russia. As the gas market is becoming more liquid, their low-cost production and stable market share would cushion a major price shock. In the short-term, their ability to influence the market is limited, but in the longer run, they could gradually become the swing producers of a global gas market, similar to the positions of the U.S. and Saudi Arabia in today’s oil scene.
