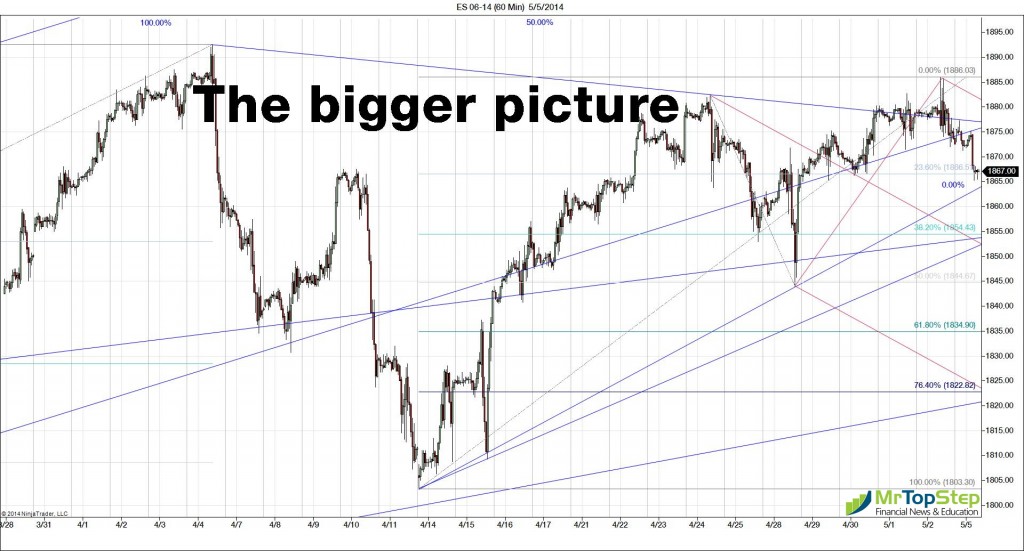
The S&P 500 futures had been up 10 out of the last 13 sessions going into Friday morning’s job numbers. The economy added 288,000 new jobs in April, higher than expected, while the unemployment rate dropped to 6.3%, the lowest since September 2008. In response, the S&P 500 (SNP:^GSPC) picked up right where it left off all week—going up and running more buy stops.
But by mid-morning stocks failed to top the pre-open high and dropped through the day to close down sharply.

The Dow Jones industrial average (DJI:^DJI) fell 45.98 points or 0.3%, to close at 16512.89 after being up as much as 61 points but was up +0.9% on the week. The S&P 500 (^GSPC) lost 2.54 points or 0.1%, to 1,881.14 and the Nasdaq Composite (^IXIC) closed down 3.55 points or 0.1%, to 4,123.90.
Perfect storm
After another round of S&P 500 stock earnings reports, of the 371 companies that have reported for Q1 2014, 74% were above the mean estimate and 52% have reported sales above the mean estimate. The Street now expects that once all 500 companies in the S&P have reported, earnings will rise 1.5% from a year ago, better numbers than expected but not what investors want to see after last year’s 30% gain.
Aside from the earnings, we have seen a slew of positive economic reports, capped off with last Friday’s record job growth. When you add it all up, it’s been a perfect storm to the upside for the S&P futures (CME:SPM14).
Fund flows: Out of bonds and into stocks
Bond futures are going back up, but that’s not stopping more money moving into the stock market. While it appears the flows may be slowing, according to information provided by Lipper on the week ending 3/23/2014 equity funds reported inflows of $2.6 billion, taxable bond funds had inflows of over 2.9 billion, and ETF-equity funds $3.1 billion.
Last week, or the week ending 4/30/2014, equity fund inflows came to $2.6 billion, taxable fund inflows $711 million, ETF-equity fund inflows $1.6 billion, and taxable bond fund inflows $216mil.
One reason the public continues to pour money into stocks is the lack of return on bond funds. Over the weekend Pimco’s Total Return Fund reported $5.5 billion in outflows across its U.S. open-end mutual funds in April, extending the company’s record outflow streak to 11 straight months, data from Morningstar showed on Friday. The Pimco Total Return Fund is the world’s largest bond fund with $230 billion in assets, and is now in its 12th straight month of investor outflows.
During that period, the Fed has gone through four tapers, reducing its buybacks nearly in half, and the unemployment rate has dropped 1.2%. It also saw the exit of former Pimco CEO and co-CIO Mohamed El-Erian. The fund is now run by Pimco co-founder and chief investment officer Bill Gross.
The point is that we live in a risk on, risk off world. With rates still close to zero and the stock market moving back up, money has been moving back into the stock market. What the totals do not take into account is all the geopolitical risk we are seeing this morning in the Ukraine.
The Asian markets closed mostly down and in Europe 7 out of 9 markers are trading lower this morning. This week’s economic calendar includes 20 separate economic releases, T-bill or T-bond announcements or auctions, 3 Federal Reserve presidents speaking and Janet Yellen speaking twice. As for today’s economic schedule, it starts with the Gallup US Consumer Spending Measure, PMI Services Index, ISM Non-Mfg Index and earnings from American International Group Inc (NYSE:AIG), Pfizer (NYSE:PFE), Invesco (NYSE:IVR), Manchester United (NYSE:MANU), and Tyson Foods (NYSE:TSN).
Our view: Mondays in 2014 have been 12 up / 5 down
Putin is warning and there have been “dozens” of strategic bombers and fighter jets patrolling the skies above the Russian-controlled Crimean peninsula. There is a very big possibility that Russian troops will intervene in eastern Ukraine. The S&P may not like that but we suspect it will continue its ascent one way or the other.
The direct causes of the S&P’s price action mostly have nothing to do with macroeconomics. It has to do with money flows and algorithmic trading and chasing stops. If the range is 1840 to 1880 the S&P has to run the sell stops under the low end of the range and then it has to run the buy stops above the upper end of the range. Once it accomplishes its task the likelihood of a reversal increases.
Our view is that while Monday is the lowest volume day of the week it also doesn’t have a bad batting average. Of the 17 Mondays in 2014, 12 have closed higher and 5 have been down. We fell short of our 1890 call by 4 handles last Friday and we have yet to see the E-mini (CME:ESM14) run the stops above 1888.70 to 1893.00, but we still think it’s coming. Today we lean to buying the early weakness and selling rallies.
As always, please keep an eye on the 10-handle rule and please use stops when trading futures and options.
- In Asia, 5 of 8 markets closed lower: Shanghai Comp. +0.05%, Hang Seng -1.28%, Nikkei CLOSED.
- In Europe, 9 of 11 markets are trading lower: DAX -1.38%, FTSE +0.20%
- Morning headline: “S&P Futures Seen Lower as Ukraine Spins Out of Control”
- S&P Fair Value: S&P -5.96, Nasdaq -8.21 , Dow -69.83
- Total volume: 1.7mil ESM and 6.3K SPM traded
- Economic calendar: Gallup US Consumer Spending Measure, PMI Services Index, ISM Non-Mfg Index. Earnings from AIG (NYSE:AIG), Pfizer (NYSE:PFE), Invesco (NYSE:IVR), Manchester United (NYSE:MANU), and Tyson Foods (NYSE:TSN).
- E-mini S&P 5001879.75+4.00 - +0.21%
- Crude102.15+0.02 - +0.02%
- Shanghai Composite0.00N/A - N/A
- Hang Seng21976.33-284.34 - -1.28%
- Nikkei 22514457.51-27.62 - -0.19%
- DAX9529.50-26.52 - -0.28%
- FTSE 1006822.42+13.55 - +0.20%
- Euro1.3879

