The airline industry is notoriously competitive. There’s even an old joke: If you want to make a million dollars in the airline business, you need to start with two million.
That joke might have run its course, however, as carriers all over the globe have been posting some of the most impressive earnings in commercial aviation’s 100-year history.
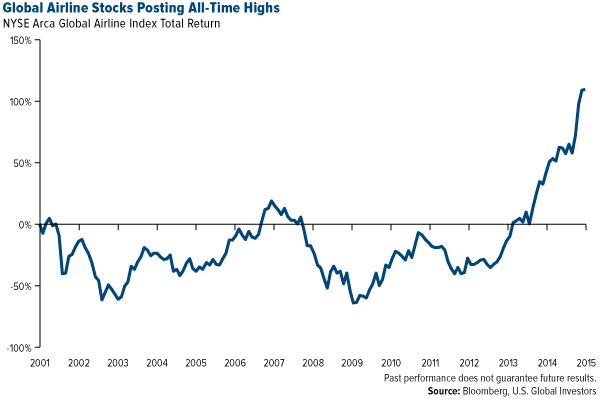
Revenue growth in the U.S. was “unusually strong” in 2014, achieving the best margin performance in the past 10 years, according to management consulting firm Oliver Wyman. The Dow Jones U.S. Airlines Index grew more than 87 percent during the year, and we’ve seen global airline stocks, as measured by the ARCA Global Airlines Index, gain significant ground since 2012 and reach all-time highs. 
Some investors might approach this rosy news with a dash of skepticism. Oil prices have fallen over 50 percent since the summer, after all, and conventional wisdom says that as soon as they start to rise again, airlines will be one of the first industries to be negatively affected.
Although it’s true that fuel is carriers’ top operating expense—they collectively spent $48 billion on fuel in 2013—there’s more to the industry’s recent bull run than the low price of oil. In fact, airlines are in a better position now to manage an increase in oil prices than they have been in recent memory, for a number of reasons.
Additional Seating
It only makes fiscal sense. The more seats an airline has, the greater the likelihood is of generating more revenue in airfare. The decision to increase seat density has helped carriers significantly lower their cost per available seat mile (CASM).
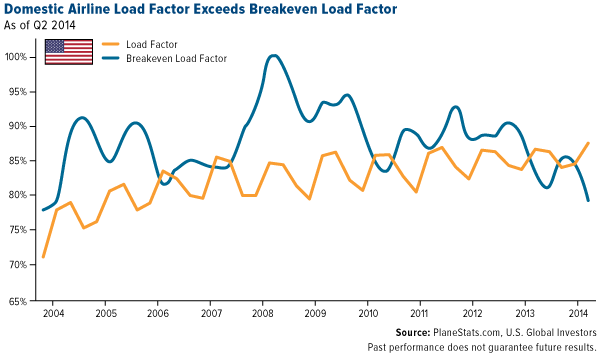
With greater seat density, carriers have had improved success at meeting and surpassing their breakeven load factors, or the necessary number of filled seats for companies to recoup operating costs.
Currently, the breakeven load factor for large domestic airlines is 79 percent, meaning around three quarters of all available seats on every flight need to be filled. According to the most recent data from the U.S. Bureau of Transportation Statistics, the load factor was an exceptional 85 percent in 2014, an increase of 1.2 percentage points from the previous year and 12 percentage points from 10 years ago.
As you can see, this has resulted in the industry’s best annual performance for the 10-year period: 
Ancillary Revenue
Another way carriers have managed to beat expectations is through ancillary, or non-ticket, fees.
Baggage fees, priority boarding, Wi-Fi, on-board meals and other fees are increasingly responsible for making up a large chunk of airlines’ earnings, allowing them to remain profitable in a highly competitive industry.
According to airline consulting group IdeaWorks, global ancillary revenue for 2013 was $31.5 billion. That’s up from $2.45 billion in 2007, which is about what Delta Air Lines (NYSE:DAL) alone generated in 2013 from such fees.
More so than major network carriers, low-cost value carriers increasingly depend on non-ticket fees to stay in the air, if you compare ancillary revenue as a percentage of total revenue in 2007 and 2013:
Ancillary Revenue as a Percentage of Total Revenue
- Annual Results - 2013 Annual Results - 2007
- Spirit Airlines Inc (NASDAQ:SAVE) 38.4% Ryanair Hldgs (NASDAQ:RYAAY) 16.2%
- Wizz Air 34.9% Vueling 14.2%
- Allegiant Air NASDAQ:ALGT Air 32.6% Allegiant Air 12.8%
- Jet2.com 27.7% Air Deccan 9.0%
- Ryanair 24.8% easyJet Plc (LONDON:EZJ) 8.8%
A Growing Middle Class
Arguably the most important factor contributing to airlines’ recent uptrend is the emergence and expansion of the middle class in the developing world. Air travel demand is strongly correlated with improved incomes. Spots around the world where we’re seeing some of the greatest surges in middle class growth are Africa, China, India and Southeast Asia.
This has led to advancement in worldwide revenue passenger miles, or the number of miles flown by commercial airlines. The most recent annual data from the Bureau of Transportation Statistics shows that over 1.1 billion miles were spent in the air in 2013, a 3.6-percent increase over the previous year.
The Organization for Economic Cooperation and Development (OECD) estimates that the middle class could increase from 1.8 billion people in 2010 to 5 billion in 2030.
Owing to a developing middle class as well as increased seat density and non-ticket fees, airlines are expected to post a collective profit of around $25 billion this year, up from $20 billion in 2014, according to the International Air Transport Association.
Also helping margins expand are low oil prices, which have stayed below $55 per barrel since the end of December. But even when prices do begin to rise, the industry should be in a good position to fly through the turbulence.
Disclosure: Past performance does not guarantee future results.
Stock markets can be volatile and share prices can fluctuate in response to sector-related and other risks as described in the fund prospectus.
Foreign and emerging market investing involves special risks such as currency fluctuation and less public disclosure, as well as economic and political risk. By investing in a specific geographic region, a regional fund’s returns and share price may be more volatile than those of a less concentrated portfolio.
The Dow Jones U.S. Airlines Index measures the performance of the portion of the airline industry which is listed in the U.S. equity market. Component companies primarily provide passenger air transport. Airports and airplane manufacturers are not included.
The NYSE Arca Global Airlines Index is a modified equal-dollar weighted Index designed to measure the performance of highly capitalized and liquid U.S. and international passenger airline companies identified as being in the airline industry and listed on developed and emerging global market exchanges.
Fund portfolios are actively managed, and holdings may change daily. Holdings are reported as of the most recent quarter-end. Holdings in the Holmes Macro Trends Fund and China Region Fund as a percentage of net assets as of 12/31/2014: Delta Air Lines, Inc. 1.28% in Holmes Macro Trends Fund; Spirit Airlines 0.00%; Wizz Air 0.00%; Allegiant Air 0.00%; Jet2.com 0.00%; Ryanair 0.00%; Vueling 0.00%; Air Deccan 0.00%; easyJet 0.00%.
All opinions expressed and data provided are subject to change without notice. Some of these opinions may not be appropriate to every investor.
