📊 Q3 Earnings are here! Plan ahead with key data on upcoming stock reports - all in 1 placeSee list

General Mills Stock: Top Performer In Q1 2019

Published 03/26/2019, 08:04 AM
Updated 07/09/2023, 06:31 AM
GIS
-

General Mills (NYSE:GIS) stock plunged by 50% in the second half of 2018, following a decline from its July peak of $72.95. So, when the stock touched $36.42 in late-December most investors were not exactly optimistic about it, to put it mildly.

On the other hand, the Elliott Wave analysis of GIS‘ daily price chart, published three months ago, revealed a different picture. Take another look at it below.

Elliott Wave analysis predicts a recovery for General Mills stock

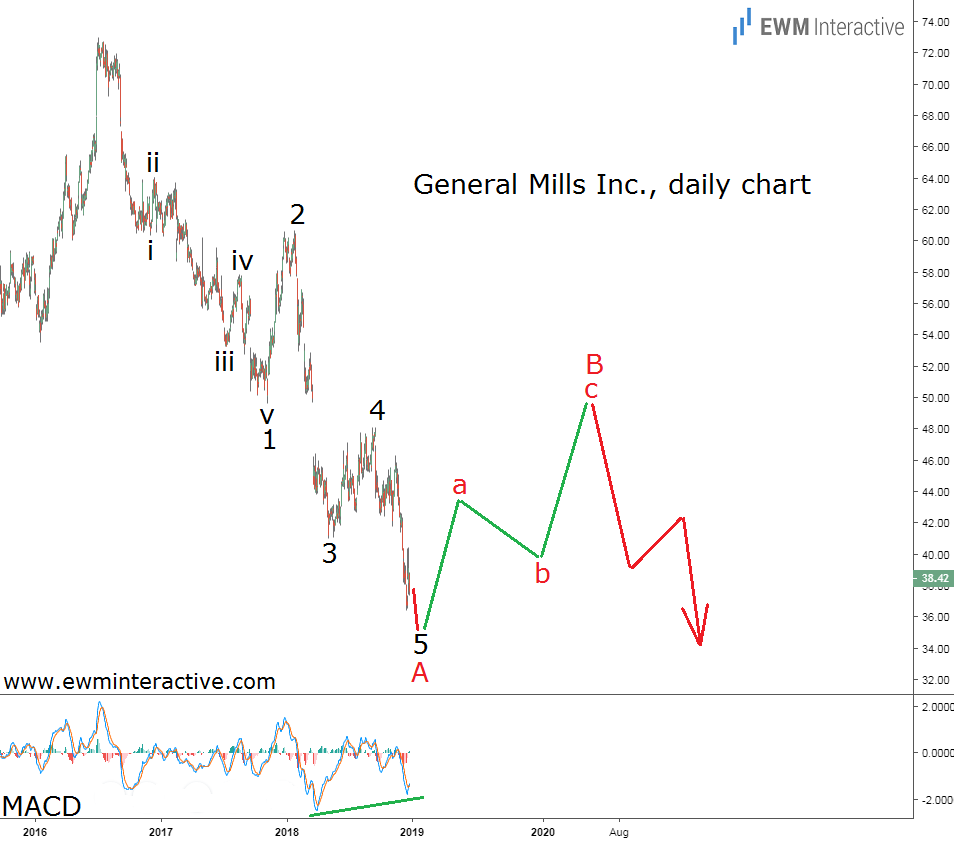
First, the decline from roughly $73 to under $36.50 had a the structure of a perfect five-wave impulse, labeled 1-2-3-4-5. According to the theory, a three-wave correction in the opposite direction was supposed to follow. In addition, there was a strong bullish MACD divergence between waves 3 and 5 – another reason not to trust the bears too much.

General Mills Stock – a Top Performer in Q1 2019

So instead of extrapolating General Mills stock’s decline into the future, we thought the stage was “set for a ~30% rally.” The resistance near $50 a share looked like a viable first target in wave B.

General Mills stock climbs 33% in three months

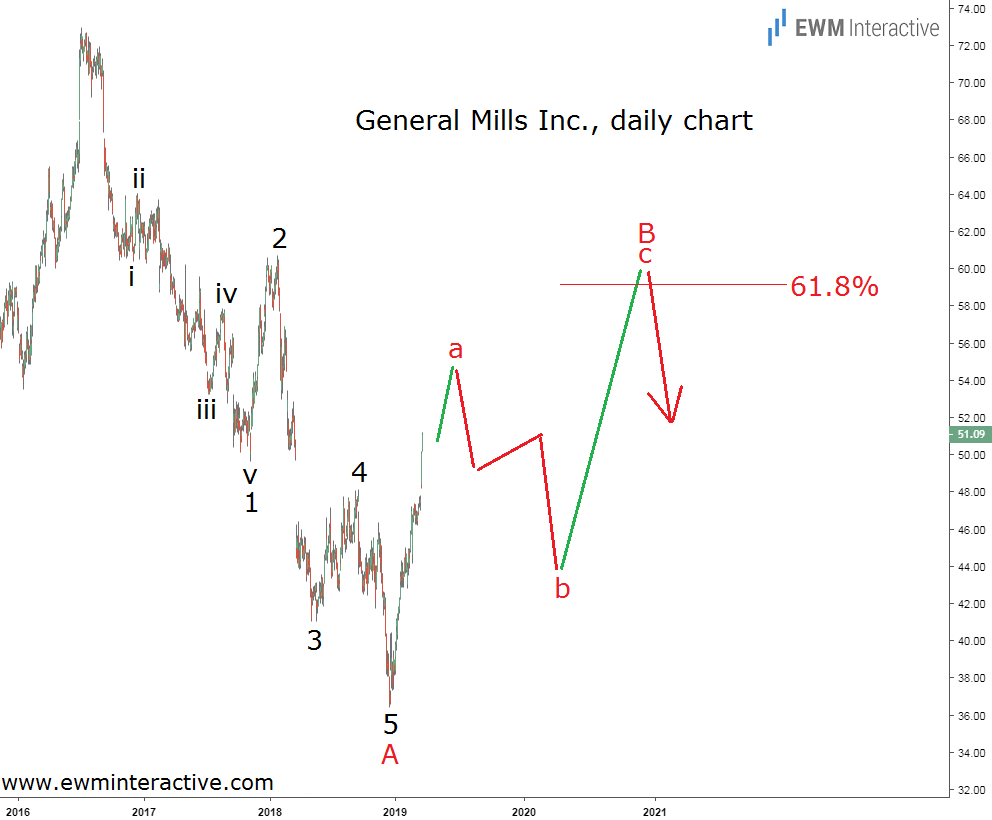
Yesterday, General Mills stock closed at $51.09, up 33% since we examined its chart. The problem is that this recovery was much sharper than we expected, which means wave B is not over yet. The manner in which the bulls conquered $50 opens the door to $60 a share, which also coincides with the 61.8% Fibonacci retracement level.

Wave B is still supposed to develop as a three-wave pattern. Once the current rally in wave “a” is over, a pullback in wave “b” of B should be expected before wave “c” can complete the sequence. In other words, General Mills stock can still add another ~20% before wave C down begins.

Original post

Latest comments

Loading next article…
Risk Disclosure: Trading in financial instruments and/or cryptocurrencies involves high risks including the risk of losing some, or all, of your investment amount, and may not be suitable for all investors. Prices of cryptocurrencies are extremely volatile and may be affected by external factors such as financial, regulatory or political events. Trading on margin increases the financial risks.
Before deciding to trade in financial instrument or cryptocurrencies you should be fully informed of the risks and costs associated with trading the financial markets, carefully consider your investment objectives, level of experience, and risk appetite, and seek professional advice where needed.
Fusion Media would like to remind you that the data contained in this website is not necessarily real-time nor accurate. The data and prices on the website are not necessarily provided by any market or exchange, but may be provided by market makers, and so prices may not be accurate and may differ from the actual price at any given market, meaning prices are indicative and not appropriate for trading purposes. Fusion Media and any provider of the data contained in this website will not accept liability for any loss or damage as a result of your trading, or your reliance on the information contained within this website.
It is prohibited to use, store, reproduce, display, modify, transmit or distribute the data contained in this website without the explicit prior written permission of Fusion Media and/or the data provider. All intellectual property rights are reserved by the providers and/or the exchange providing the data contained in this website.
Fusion Media may be compensated by the advertisers that appear on the website, based on your interaction with the advertisements or advertisers.
© 2007-2024 - Fusion Media Limited. All Rights Reserved.