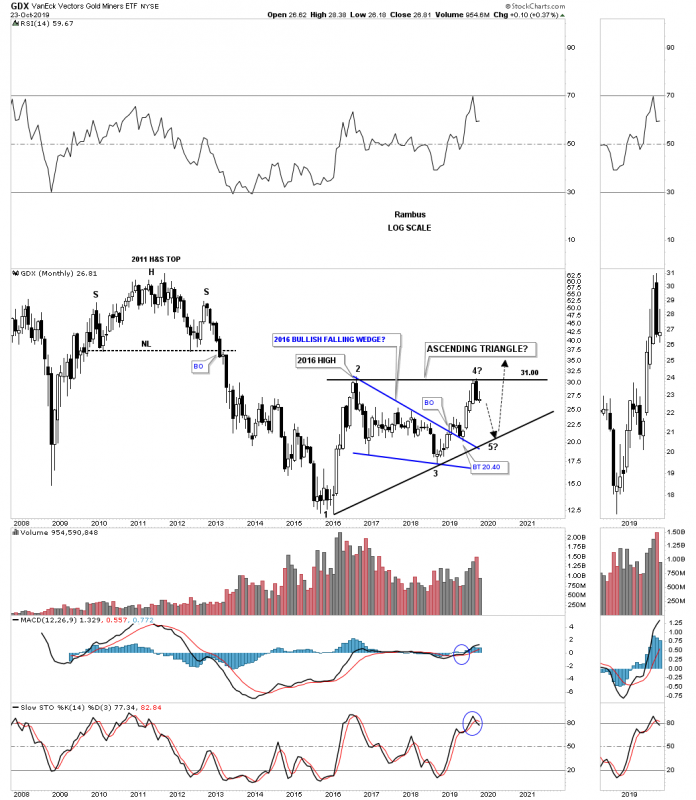
“Keeping an open mind when it comes to trading the markets is paramount. If one gets locked into one scenario and refuses to acknowledge any other possibility you will eventually find yourself on the wrong side of the trade. Even though I have a ton of bullish charts for the PM complex I also have just as many charts which show possible negative price action.
This last chart from yesterday is one I posted several weeks ago when the possible H&S top began forming.
As I mentioned earlier when the GDX (NYSE:GDX) trade up to the 2016 high, we want to see a small consolation pattern form and not an H&S top reversal pattern.
If the small H&S top does play out it’s going to reverse the 2018 rally which will end up being the 4th reversal point in a much bigger triangle. The blue 2016 falling wedge will end up being part of the internal structure of the almost now 4-year triangle pattern. I don’t show it on this chart but reversal point #1 was the 2015 double bottom reversal pattern. Reversal point #2 was the 2016 H&S top. Reversal point #3 was the 18-month H&S bottom. If the 2019 possible H&S top reversal pattern plays out that will setup the 4th reversal point to the downside which could find a low at the bottom rail.

This is only a possibility right now until we get more confirmation that the possible 2019 H&S top is the real deal. Generally speaking, an ascending triangle is generally a bullish pattern. An old adage I heard growing up that has stuck with me all these years goes something like this,
”When everyone is thinking the same no one is thinking at all.”