GC_F Flipped A Coin, It’s Tails

Published 08/22/2016, 09:03 AM
Updated 05/14/2017, 06:45 AM

GC_F Day chart shows price completed a bearish harmonic pattern, called a Shark at 1386.6, then flipped a coin while in a triangular formation and Friday’s close below the triangle says “it’s tails”. A valid breakdown of the triangle, aka should price bounce up to 1346 area and hold below there, has an ideal minimum retrace target at 1261 and ideal targets at 1222.3 or 1058.2 which would be extreme.
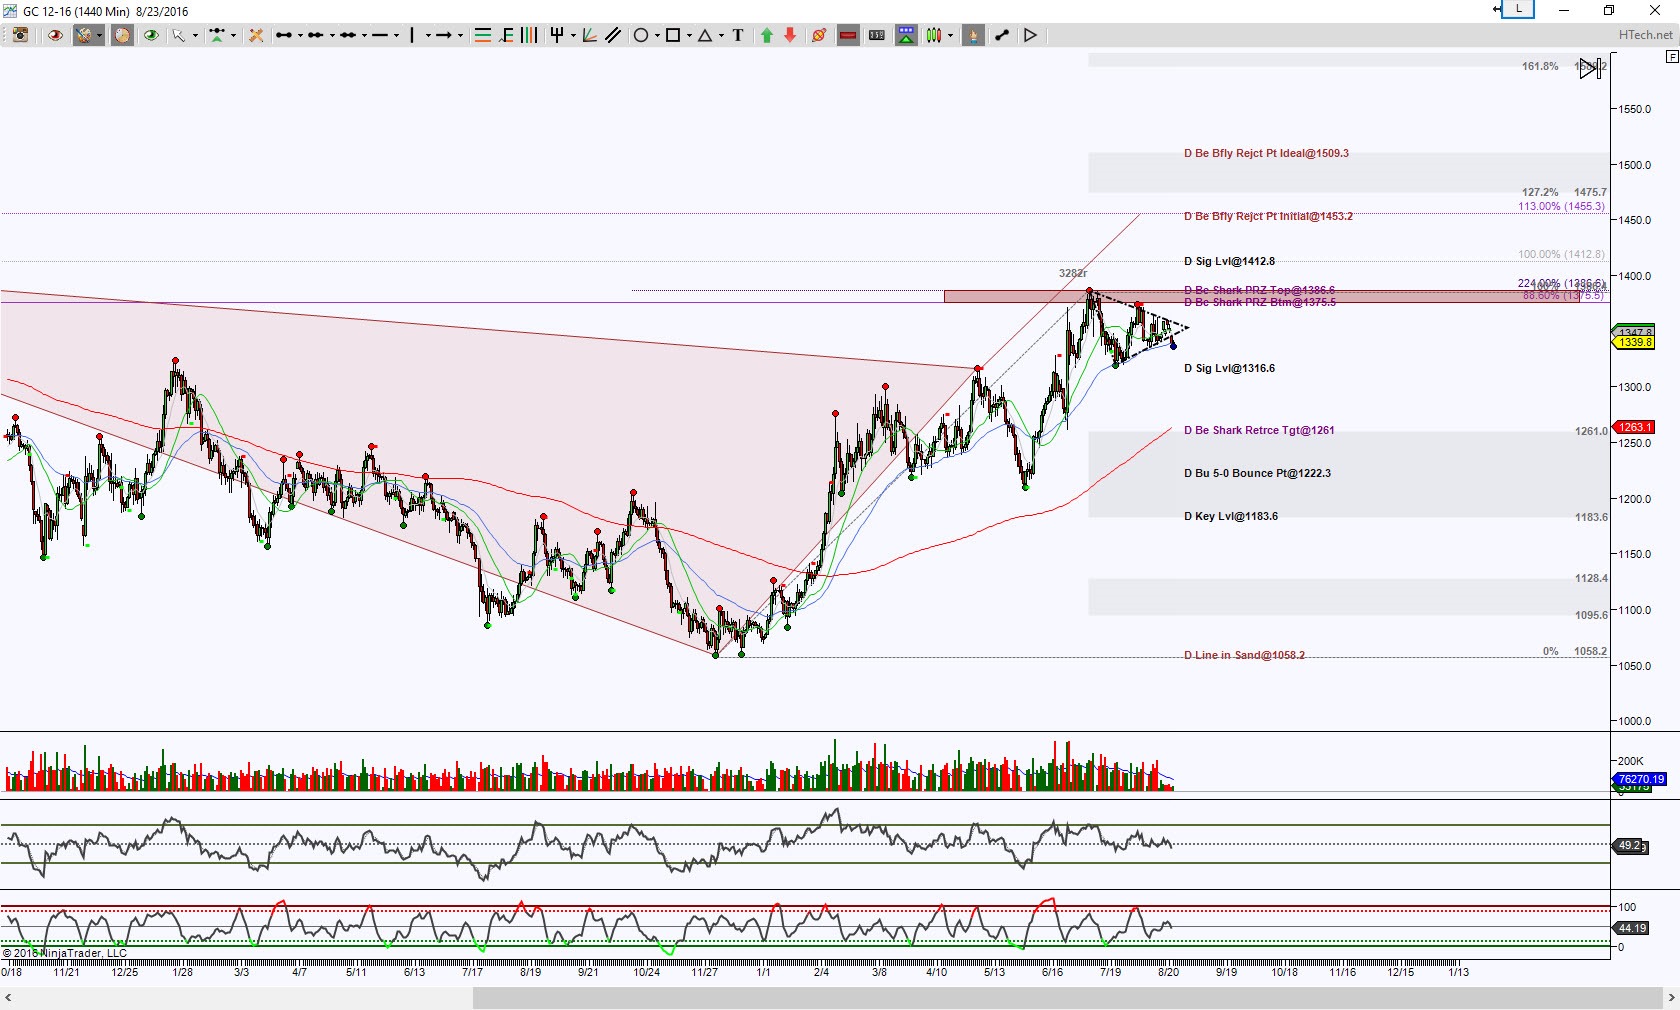
GC_F Day chart

GC_F Day chart

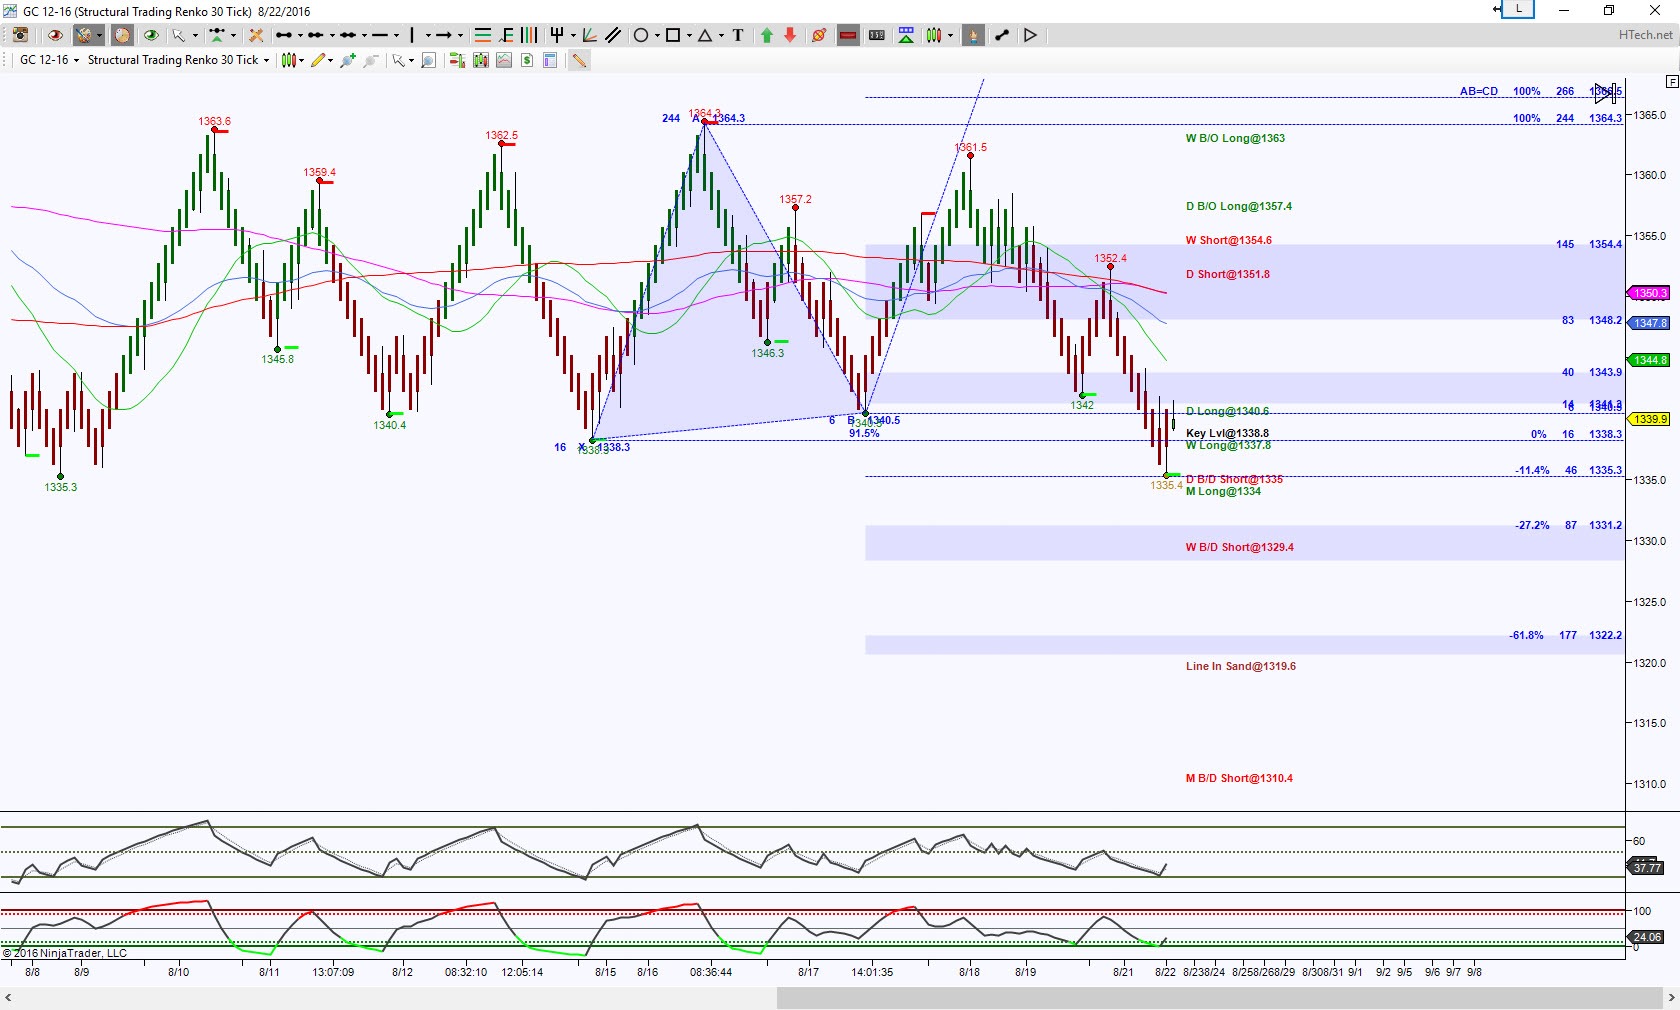
Now for an intraday perspective, I’m looking at an STRenko 30 bar chart which shows that there is some convergence at 1335.3 for support test and if price can hold back above 1340.5, the probability is to test 1344.8 to 1348.2 for resistance, this would correlate with that Day chart triangle breakdown point.
GC_F STR30

GC_F STR30

Harmonically speaking there’s a calling to 1322.2 region, and that scenario increases with a hold below 1335.3, then that would be another coin flip area. Harmonic patterns offer targets as well as probable rejection points, so when they complete, they are places to take some scaling profits or prepare for a potential rejection.

Trading involves substantial risk and is not suitable for all investors. Past performance is not indicative of future results.

by Kathy Garber

Original post

Latest comments

Loading next article…
Risk Disclosure: Trading in financial instruments and/or cryptocurrencies involves high risks including the risk of losing some, or all, of your investment amount, and may not be suitable for all investors. Prices of cryptocurrencies are extremely volatile and may be affected by external factors such as financial, regulatory or political events. Trading on margin increases the financial risks.
Before deciding to trade in financial instrument or cryptocurrencies you should be fully informed of the risks and costs associated with trading the financial markets, carefully consider your investment objectives, level of experience, and risk appetite, and seek professional advice where needed.
Fusion Media would like to remind you that the data contained in this website is not necessarily real-time nor accurate. The data and prices on the website are not necessarily provided by any market or exchange, but may be provided by market makers, and so prices may not be accurate and may differ from the actual price at any given market, meaning prices are indicative and not appropriate for trading purposes. Fusion Media and any provider of the data contained in this website will not accept liability for any loss or damage as a result of your trading, or your reliance on the information contained within this website.
It is prohibited to use, store, reproduce, display, modify, transmit or distribute the data contained in this website without the explicit prior written permission of Fusion Media and/or the data provider. All intellectual property rights are reserved by the providers and/or the exchange providing the data contained in this website.
Fusion Media may be compensated by the advertisers that appear on the website, based on your interaction with the advertisements or advertisers.
© 2007-2025 - Fusion Media Limited. All Rights Reserved.