GBPUSD – Approaching Multi-Year Resistance
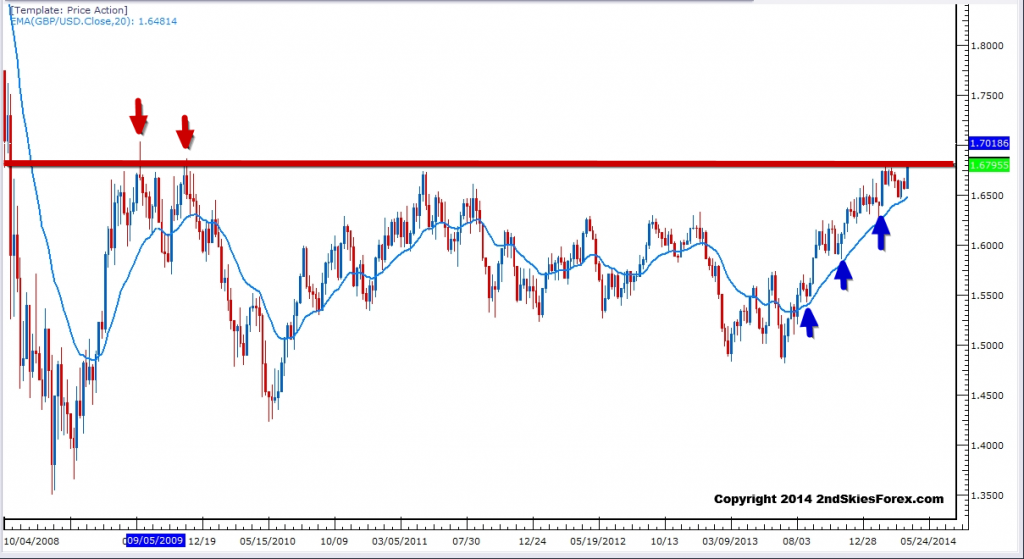
If you look at the daily chart, what you’ll see is the yearly resistance coming in around 1.6820. But step back to the weekly chart, and you’ll see the cable is trying to take out some major resistance. How big? Levels that have not been seen since 2009.
Looking at the price action and the chart below, we can see only a few other weekly peaks above the current one being made. They are (besides the 2014 high), 1.6877 from Nov. 09′, and 1.7040 from Aug. 09′.
My guess is either a) we get a massive breakout taking out the stops and options barriers above these 4 year peaks, or b) we run into some heavy sellers protecting those levels.
Although I’d rather be short USD than long, I think this is getting over-extended for the cable. So I’ll look to short at 1.6850/70, and 1.7000/7020 with stops above the Aug. highs. Downside targets will be the weekly 20 ema & dynamic support (held since Aug. 13′) around 1.6500.
Original post
- English (UK)
- English (India)
- English (Canada)
- English (Australia)
- English (South Africa)
- English (Philippines)
- English (Nigeria)
- Deutsch
- Español (España)
- Español (México)
- Français
- Italiano
- Nederlands
- Português (Portugal)
- Polski
- Português (Brasil)
- Русский
- Türkçe
- العربية
- Ελληνικά
- Svenska
- Suomi
- עברית
- 日本語
- 한국어
- 简体中文
- 繁體中文
- Bahasa Indonesia
- Bahasa Melayu
- ไทย
- Tiếng Việt
- हिंदी
GBPUSD – Gunning For Major Resistance
Published 04/10/2014, 04:10 AM
GBPUSD – Gunning For Major Resistance
Latest comments
Loading next article…
Install Our App
Risk Disclosure: Trading in financial instruments and/or cryptocurrencies involves high risks including the risk of losing some, or all, of your investment amount, and may not be suitable for all investors. Prices of cryptocurrencies are extremely volatile and may be affected by external factors such as financial, regulatory or political events. Trading on margin increases the financial risks.
Before deciding to trade in financial instrument or cryptocurrencies you should be fully informed of the risks and costs associated with trading the financial markets, carefully consider your investment objectives, level of experience, and risk appetite, and seek professional advice where needed.
Fusion Media would like to remind you that the data contained in this website is not necessarily real-time nor accurate. The data and prices on the website are not necessarily provided by any market or exchange, but may be provided by market makers, and so prices may not be accurate and may differ from the actual price at any given market, meaning prices are indicative and not appropriate for trading purposes. Fusion Media and any provider of the data contained in this website will not accept liability for any loss or damage as a result of your trading, or your reliance on the information contained within this website.
It is prohibited to use, store, reproduce, display, modify, transmit or distribute the data contained in this website without the explicit prior written permission of Fusion Media and/or the data provider. All intellectual property rights are reserved by the providers and/or the exchange providing the data contained in this website.
Fusion Media may be compensated by the advertisers that appear on the website, based on your interaction with the advertisements or advertisers.
© 2007-2025 - Fusion Media Limited. All Rights Reserved.
