GBP/USD
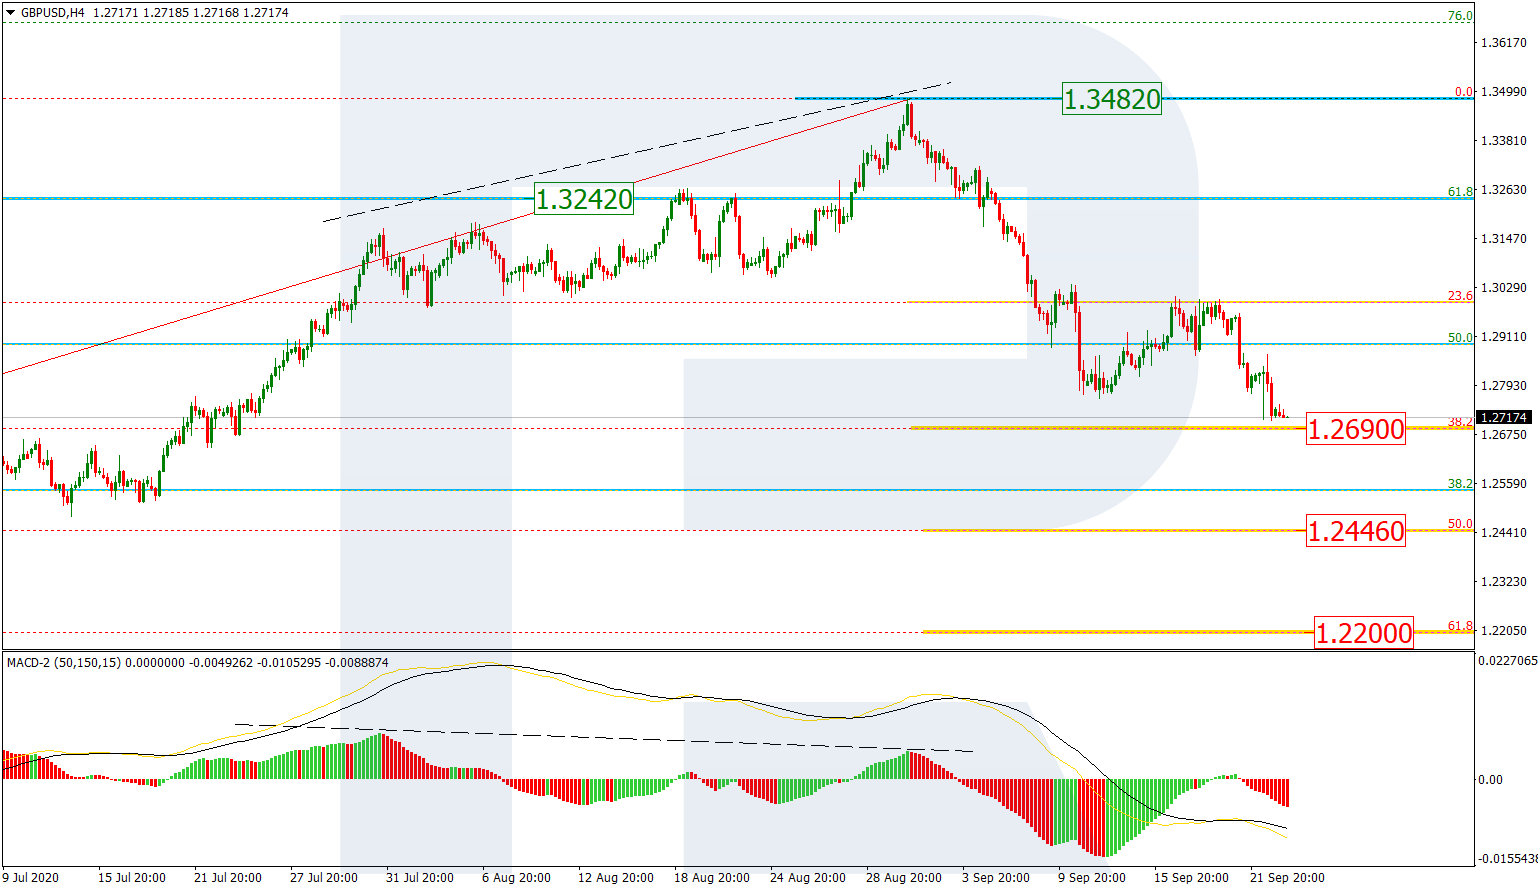
As we can see in the H4 chart, GBP/USD is falling after divergence and getting closer to 38.2% fibo at 1.2690. This level supported the asset earlier, that’s why it may form a local consolidation range or start a pullback here. After completing the correction, the next descending impulse may be heading towards 50.0% and 61.8% fibo at 1.2446 and 1.2200 respectively. The resistance is the long-term 50.0% fibo at 1.3243.
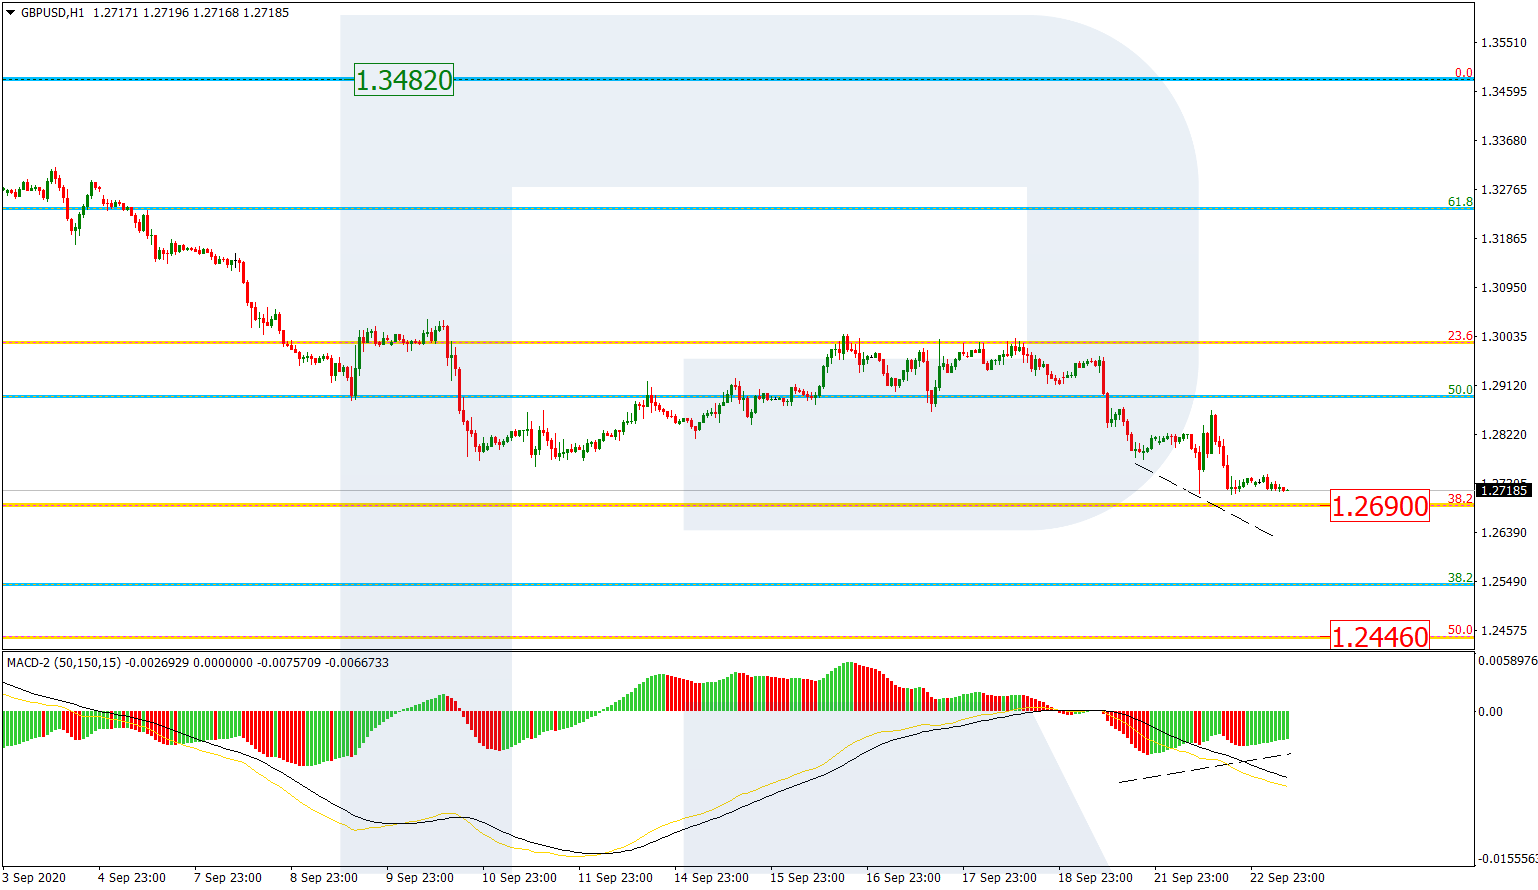
In the H1 chart, there is a convergence on MACD, which confirms a possible pullback. Here, the pair may break 38.2% fibo at 1.2690 and continue falling to test 50.0% fibo at 1.2446. After that, the instrument may rebound and even form a new ascending wave towards the high at 1.3482.
EUR/JPY
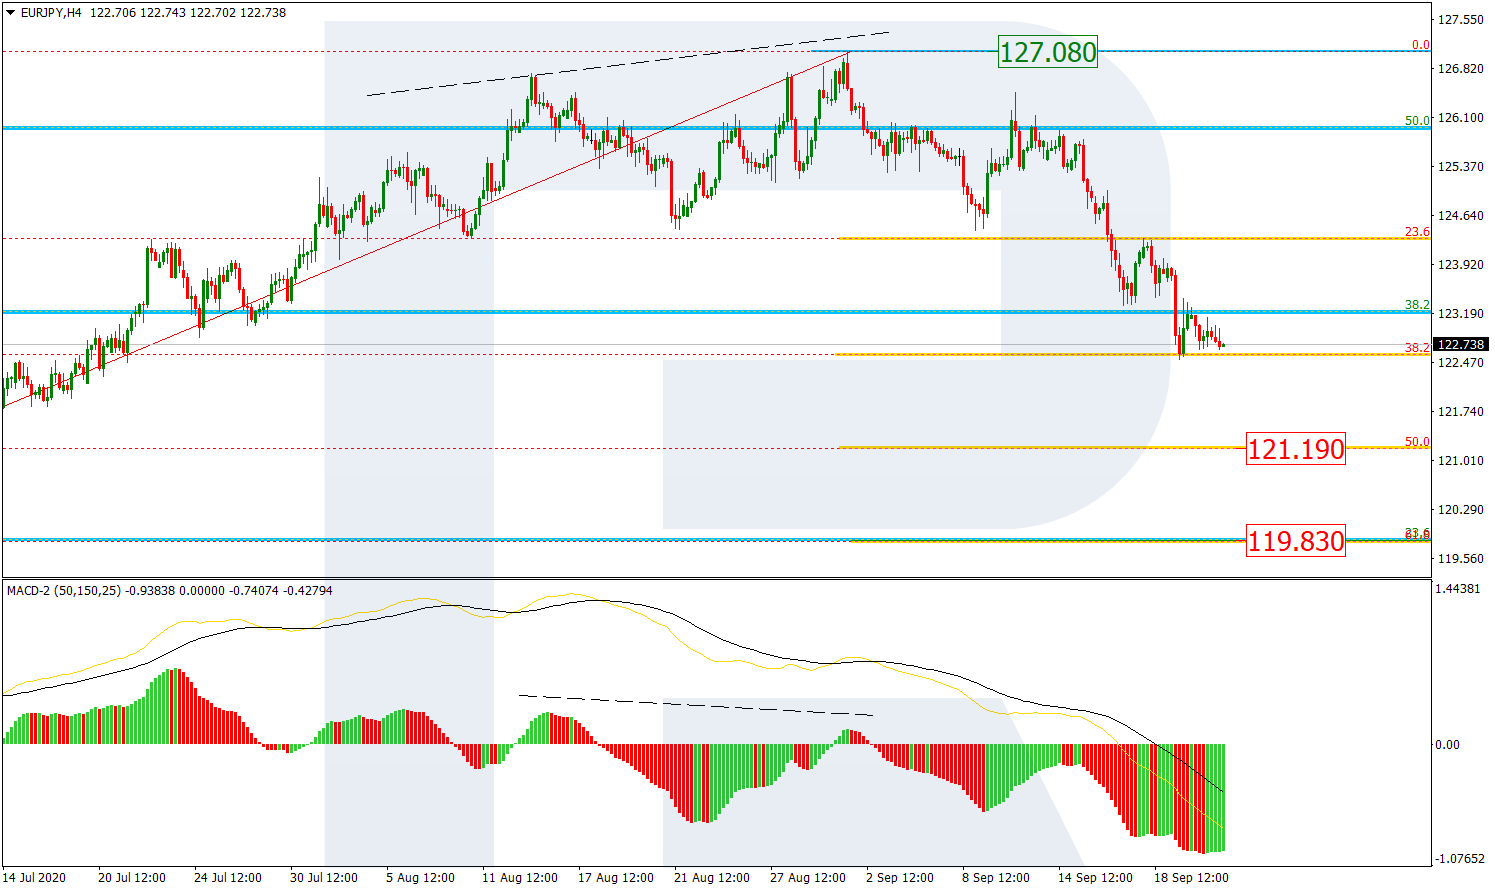
As we can see in the EUR/JPY H4 chart, after a breakout of 50.0% fibo and a divergence on MACD, EURJPY is still correcting to the downside and has already reached 38.2% fibo and rebounded from it. Possibly, the pair may trade sideways around this level but after finishing this short-term correction it is expected to resume falling towards 50.0% and 61.8% fibo at 121.19 and 119.83 respectively. The resistance is the high at 127.08.
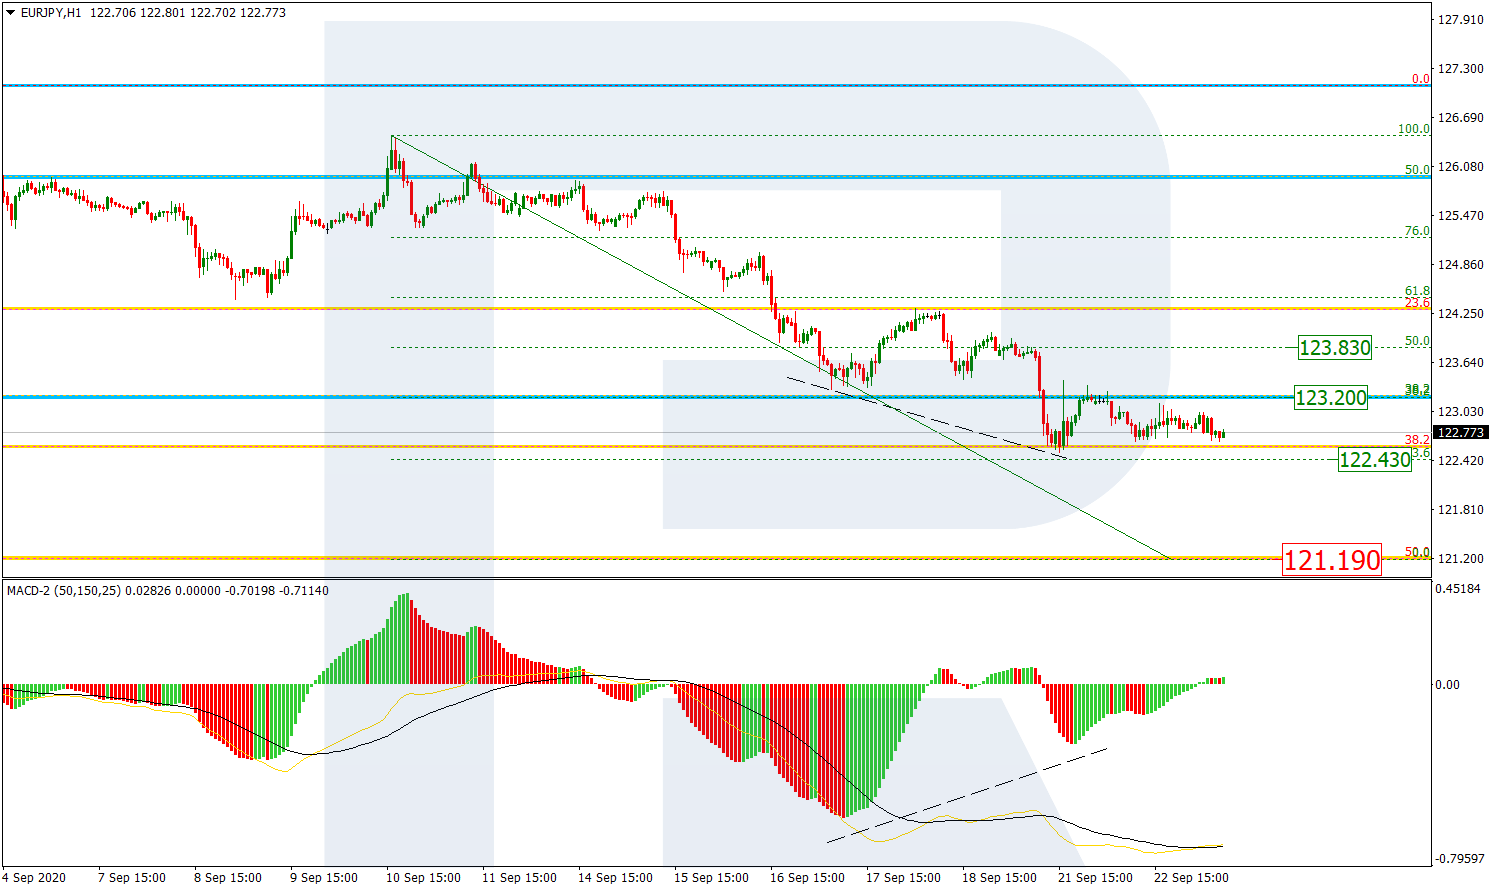
In the H1 chart, the pair was stopped at 38.2% fibo by the convergence on MACD, which may indicate a possible pullback. In this case, the instrument is expected to fall towards 50.0% fibo at 121.19, rebound from it, and then start a new correction to the upside. The targets are 23.6%, 38.2%, and 50.0% fibo at 122.43, 123.20, and 123.83 respectively.
