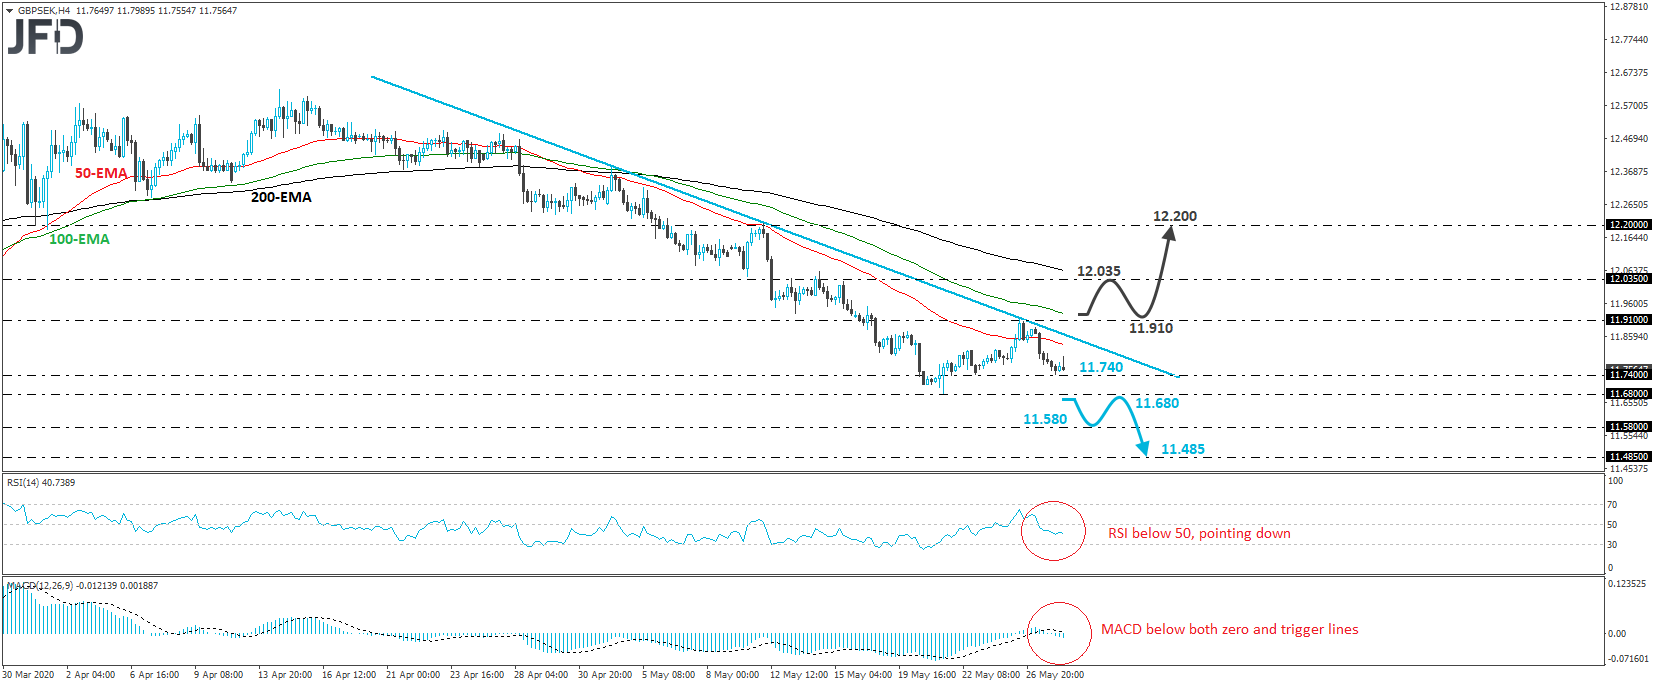
GBP/SEK traded lower on Wednesday and Thursday, after it hit resistance at 11.910 on Tuesday.
At the time of the test, the 11.910 level coincided with a downside resistance line drawn from the high of May 4th. This, combined with the fact that the rate is trading below all three of our moving averages on the 4-hour chart, paints a negative near-term picture, in our view.
That said, in order to get confident on larger declines, we would like to see a strong break below 11.680, a support defined by the low of May 21. Such a move would confirm a forthcoming lower low and may initially pave the way towards the low of Aug. 15, 2019, at 11.580. If that barrier is broken as well, then we may experience extensions towards the 11.450 area, which lies slightly above the low of August 14th, 2019, and marks the low of the day before.
The RSI and the MACD detect negative momentum and support the notion for further declines in this exchange rate. The RSI lies below 50 and points down, while the MACD stands below both its zero and trigger lines, pointing south as well.
The move that would change the outlook to a somewhat positive one may be a break above 11.910. The rate would already be above the pre-mentioned downside line, while the move above 11.910 would confirm a forthcoming higher high. The bulls may get encouraged to target the 12.035 territory first, the break of which may set the stage for advances towards the high of May 12th, at around 12.200.
