Investing.com’s stocks of the week
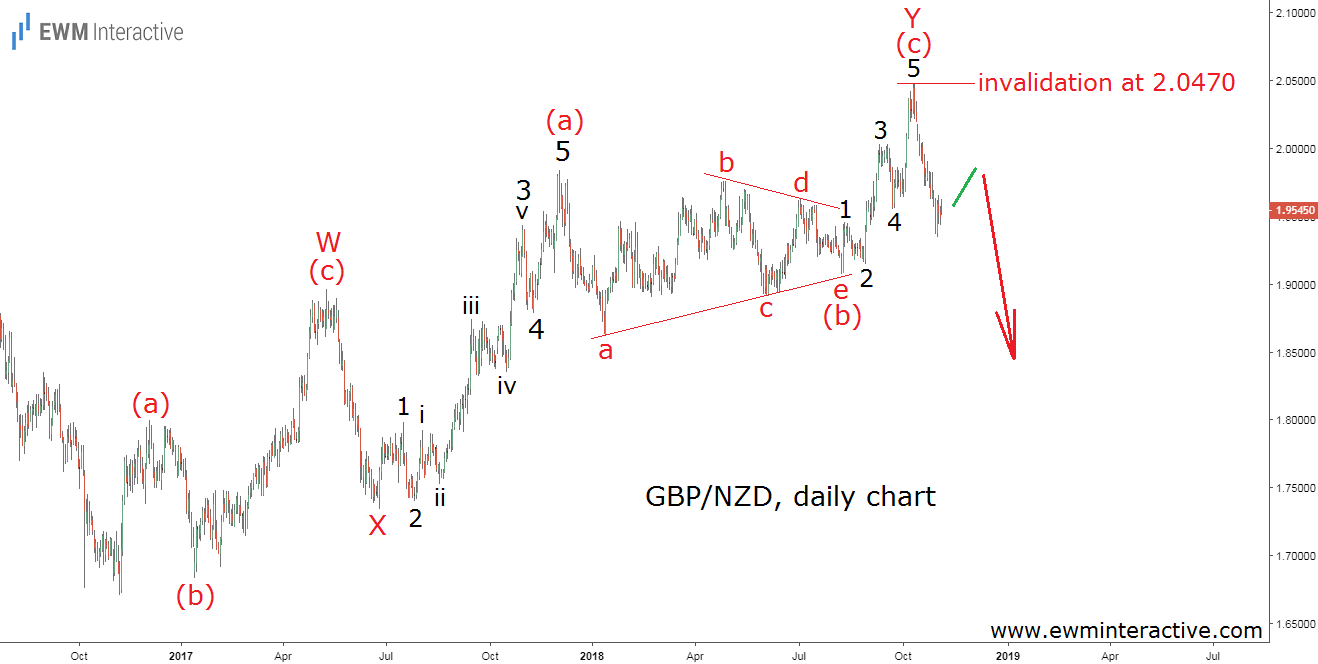
On November 2nd, GBP/NZD was trading above 1.9550. As of this writing, the pair is hovering slightly below 1.8400, meaning the British pound lost over 1150 pips against the New Zealand dollar in a single month. Fortunately, the Elliott Wave Principle put traders ahead of this sharp selloff. The chart below, published on November 5th, shows that Brexit woes were not the only reason to turn bearish on GBP/NZD.
The daily chart revealed a W-X-Y double zigzag correction between 1.6705 and 2.0470. Once a correction is over, the larger trend resumes. Since GBP/NZD was in a downtrend prior to this recovery, it made sense to expect more weakness going forward. Now, over 1150 pips to the south later, the long-term negative outlook is still valid and targets below 1.6705 remain plausible.
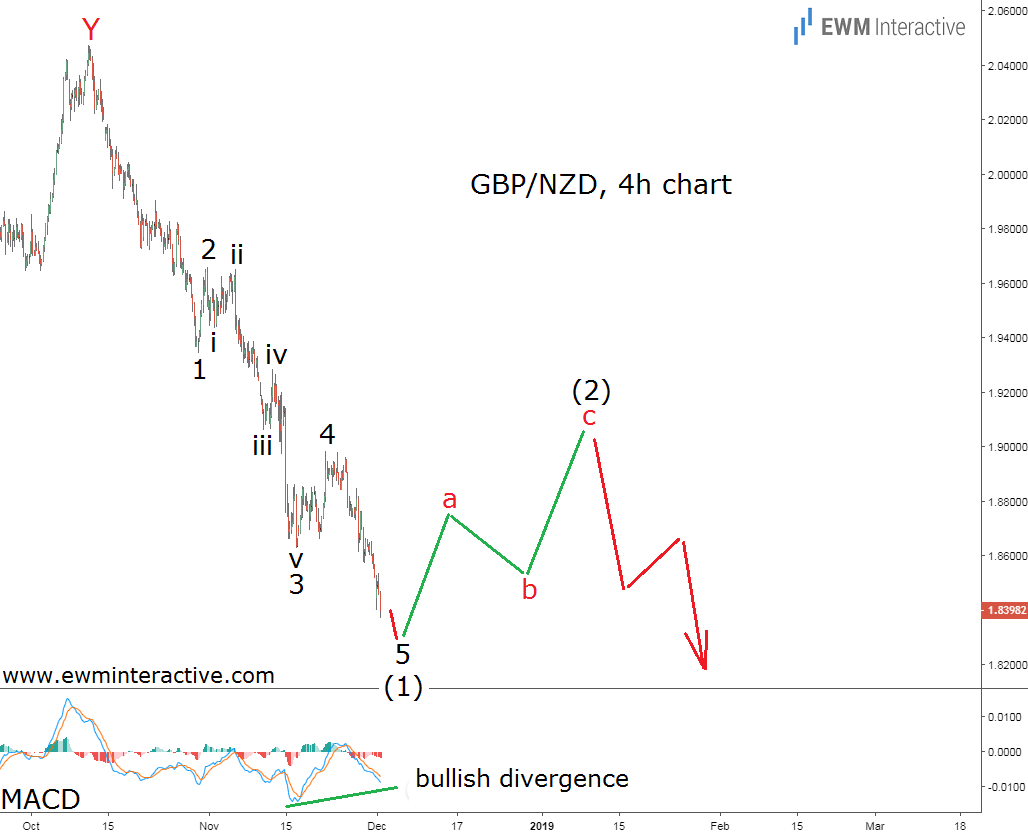
This, however, does not mean we should expect the decline to develop in a straight line. There are always counter-trend moves along the way and the 4-hour chart below suggest we can anticipate one soon.
The 4-hour chart visualizes the pair’s entire drop from 2.0470 to 1.8369 so far. We have labeled it 1-2-3-4-5 in wave (1), because it has the structure of a five-wave impulse pattern. The sub-waves of wave 3 are also easily recognizable.
According to the theory, a three-wave correction in the opposite direction follows every impulse. So, if the above-shown count is correct, we should not be surprised to see a recovery in wave (2) to the resistance area of wave 4 of (1) before the bears return. The short-term positive outlook is also supported by a bullish MACD divergence between waves 3 and 5.
To conclude, the big picture still suggests GBP/NZD is headed much lower in the long run. The short-term view, on the other hand, indicates a recovery to roughly 1.9000 is around the corner. However, picking bottoms is extremely risky so long positions are not a good idea. Trading in the direction of the trend and not against it usually pays off handsomely and wave (2) would provide better selling opportunities.
