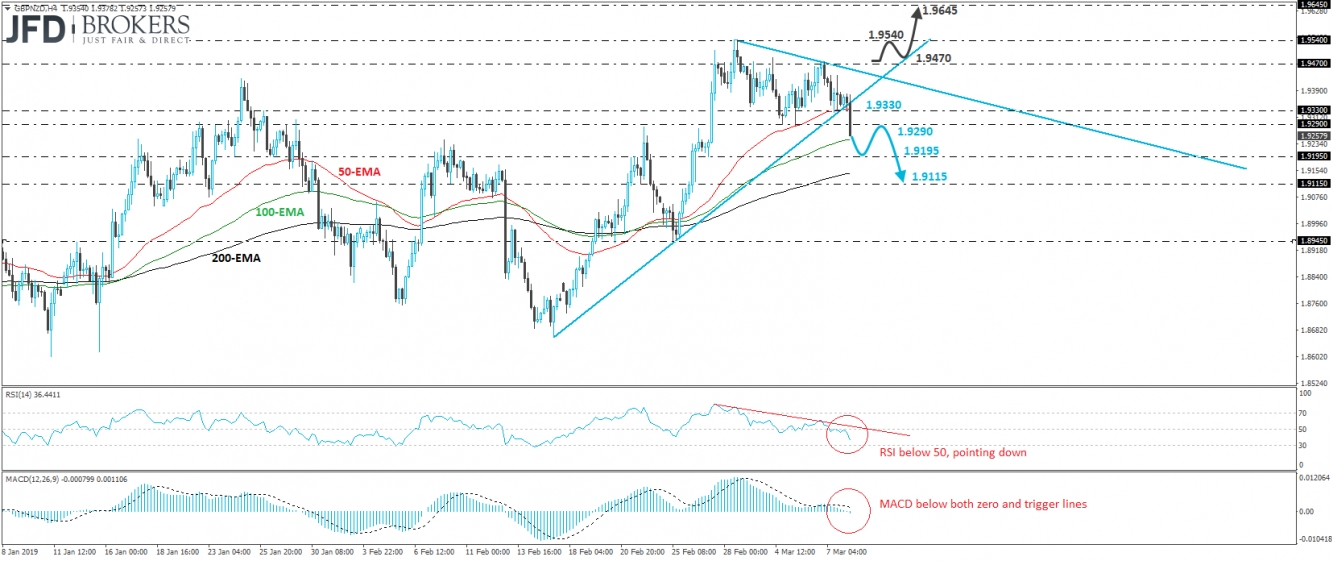
GBP/NZD tumbled during the European morning Friday, breaking below the 1.9330 level and the upside support line drawn from the low February 15th. Then, the rate dipped below the 1.9290 support (now turned into resistance), that way completing a failure swing top formation on the 4-hour chart. What’s more, the pair is also trading below a downside line taken from the high of February 28th. So, having all that in mind, we believe that the short-term picture has now turned to the downside.
We believe that the break below 1.9290 may have opened the way for the 1.9195 zone, defined by the low of February 27th. If that zone fails to halt the slide, then we may experience extensions towards the 1.9115 barrier, which is marked by an intraday swing low formed on February 21st. Another break, below 1.9115, may carry larger bearish implications, perhaps paving the way for the low of February 25th at around 1.8945.
Looking at our short-term oscillators, we see that the RSI runs below 50 and points down, while the MACD, already below its trigger line, has just touched its toe below zero. These indicators detect negative momentum and corroborate our view for some further short-term declines.
On the upside, we would like to see a clear close above 1.9470 before we start examining whether the bears have abandoned the battlefield. Such a move would bring the rate above both the aforementioned diagonal lines and may initially aim of the peak of February 28th, at around 1.9540. If the bulls do not stop at that obstacle, their next destination may be the high of November 6th, near 1.9645.

