Investing.com’s stocks of the week
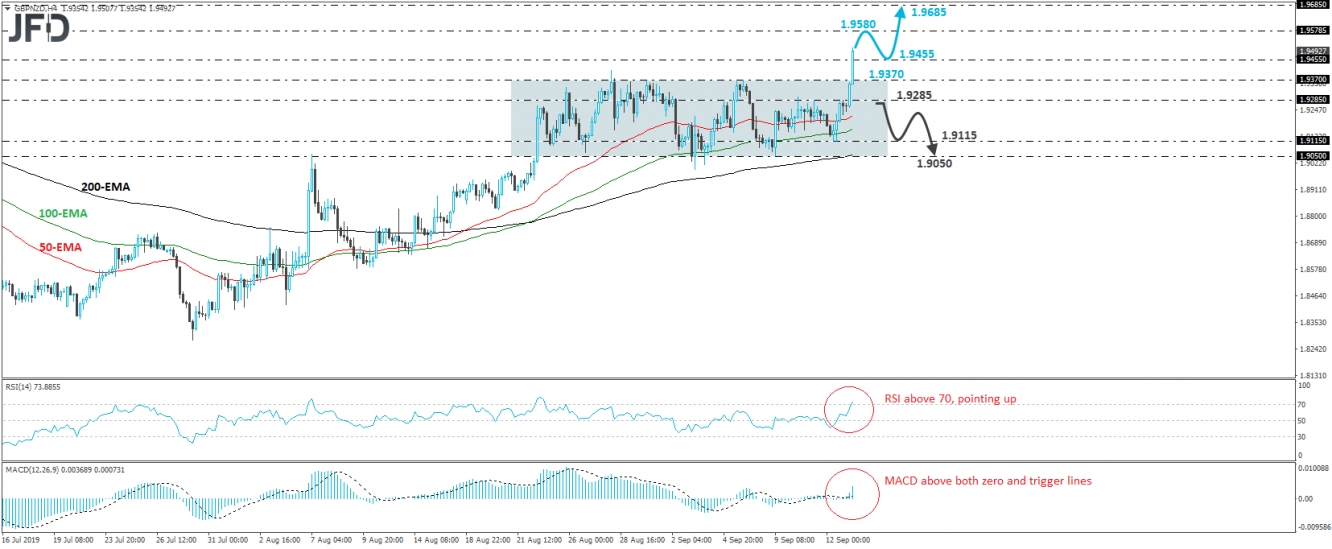
GBP/NZD surged on Friday, breaking above the key resistance territory of 1.9370, which acted as the upper bound of the sideways range that contained most of the price action since August 22nd. The break has confirmed a forthcoming higher high on both the 4-hour and daily charts, and in our view, it signals the continuation of the prevailing uptrend.
The bulls have also managed to overcome the 1.9455 hurdle, marked by the high of May 29th, a break that may have opened the path towards the 1.9580 zone, which is near the peak of May 22nd. They could take a break after testing that area, thereby allowing a small retreat, but as long as the rate would be trading above the upper bound of the pre-discussed range, we would still see a positive near-term outlook, and thus, decent chances of another leg north. The forthcoming positive wave may drive the pair above 1.9580, a move that could see scope for extensions towards the peak of May 21st, at around 1.9685.
Looking at our short-term oscillators, we see that the RSI just poked its nose above its 70 line, while the MACD lies above both its zero and trigger lines, pointing up as well. These indicators detect strong upside speed and support the notion for the bulls to stay behind the steering wheel.
On the downside, a dip back below 1.9285 could confirm the rate’s return back within the aforementioned sideways range, in which case we will abandon the bullish view. Such a slide may pave the way towards the 1.9115 support, marked by the low of September 12th, the break of which may allow the slide to continue towards the lower end of the range, at around 1.9050.

