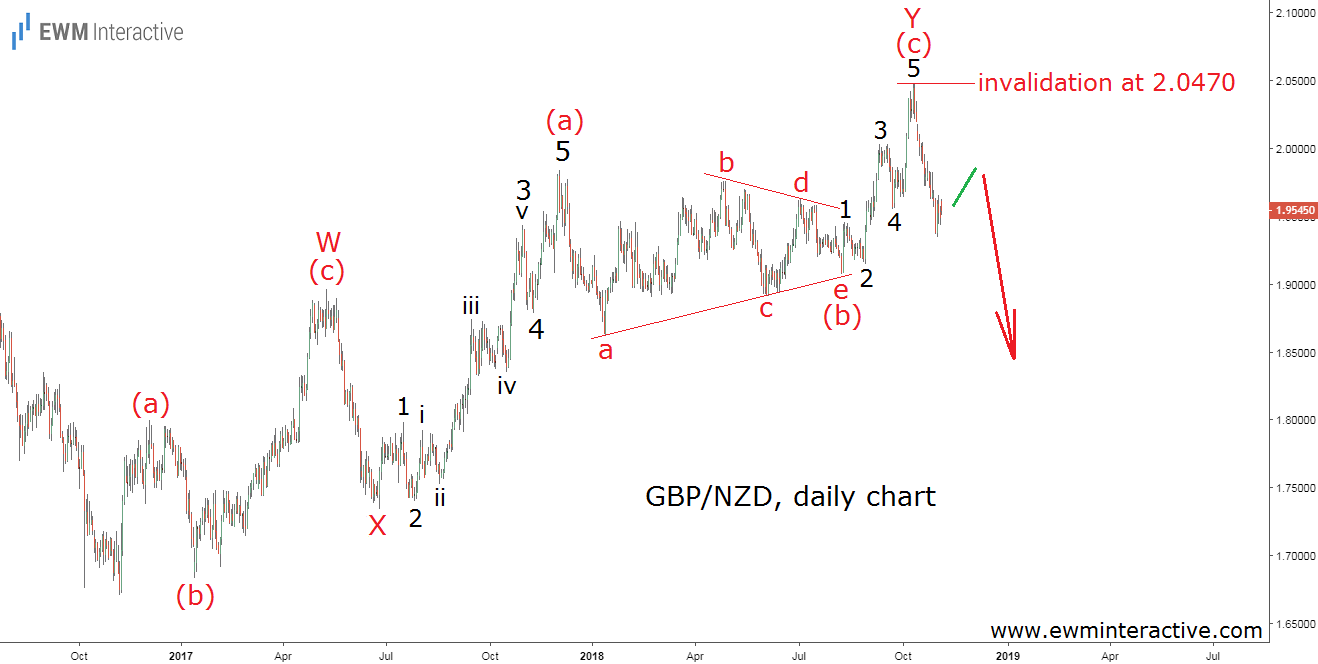
GBP/NZD has been in recovery mode for the past two years. The pair took off from 1.6705 in November 2016 and climbed to as high as 2.0470 in October 2018. The pound’s rally may seem counter-intuitive on the back of Brexit concerns in the United Kingdom, but that won’t be the first time the market disagrees with traditional wisdom.
As Warren Buffett once put it, traditional wisdom is often long on tradition, but short on wisdom. However, if there is one thing we know for sure, it is that no trend lasts forever. Last month, GBP/NZD fell from its multi-year high of 2.0470 to 1.9342. Our job is to try and determine whether this dip is a buying opportunity or the beginning of a larger decline. The Elliott Wave Principle can help us find out.
The daily chart of the British pound against the New Zealand dollar visualizes the pair’s entire 2-year recovery. It looks like a textbook W-X-Y double zigzag correction. Waves W and Y can both be labeled as simple (a)-(b)-(c) zigzags. The impulsive structure of waves (a) and (c) of Y is also clearly visible, while wave (b) of Y is an a-b-c-d-e triangle pattern.
Once a correction is over, the larger trend resumes. Here, a sharp selloff from 2.5319 in August 2015 precedes the above-shown corrective recovery, so the larger trend is down. If this count is correct, last month’s bearish reversal is the start of a major plunge, whose targets lie beneath 1.6700 in the long term. In our opinion, selling the rallies is a viable strategy as long as GBP/NZD trades below 2.0470. Instead of giving in to complacency, the bulls should take last month’s bearish reversal very seriously…
