The possibility of a no-deal Brexit received another boost after Boris Johnson became Prime Minister of the UK. The market, however, doesn’t seem to like those prospects. The Pound Sterling has been losing ground against the euro, the Aussie, the US dollar and other rival currencies. GBP/NZD is down, too.
Less than three months ago, on May 8th, GBP/NZD pierced the 2.0000 mark. Two days ago, the pair fell to 1.8280 for a decline of more than 17 figures. We have been skeptical about GBP/NZD ever since discovering this corrective pattern on its daily chart in November 2018.
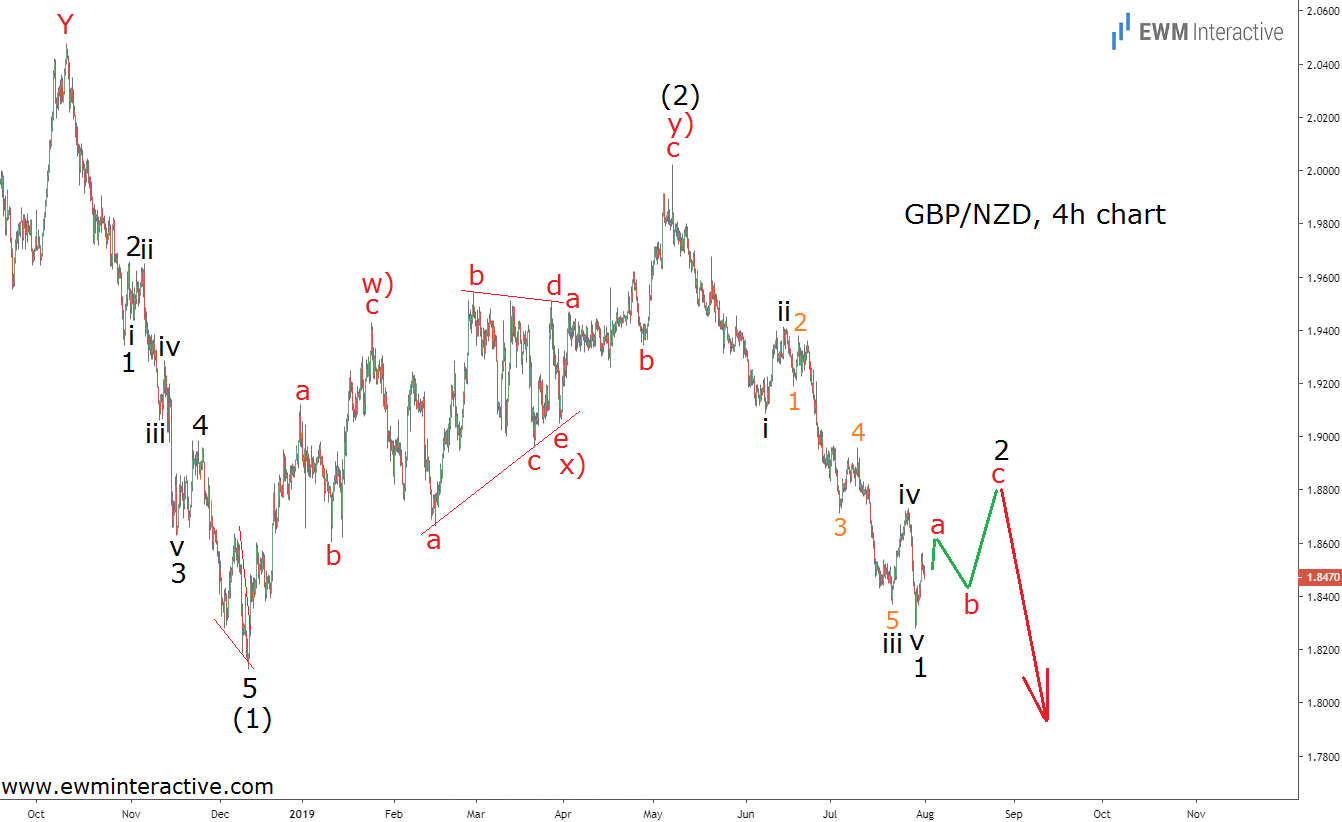
To find out if the big picture negative outlook is still valid we need to see where does the current selloff fit into the Elliott Wave count. The chart below helps with that task.

The 4-hour chart reveals the structure of the price action since the top at 2.0477 in October 2018. First, there was a five-wave impulse down to 1.8127, labeled 1-2-3-4-5 in wave (1). The five sub-waves of wave 3 are also visible, while wave 5 is an ending diagonal.
Then there was a big w)-x)-y) double zigzag correction in wave (2) up to 2.0024. Waves w) and y) are simple a-b-c zigzags, while wave x) is a textbook triangle. This brings us to the current plunge to 1.8280 so far. It can be seen as a five-wave structure, as well, labeled i-ii-iii-iv-v in wave 1.
Are GBPNZD Bulls Ill-Prepared for a No-Deal Brexit?
If this count is correct, once the corresponding three-wave recovery in wave 2 is over, we can expect more weakness in wave 3 of (3). How is the Brexit drama going to unfold remains unknown, but it looks like the market is already preparing for the worst. Impulsive pattern point in the direction of the larger trend. GBP/NZD has drawn not one but two of them to the south.
