⭐ Start off 2025 with a powerful boost to your portfolio: January’s freshest AI-picked stocksUnlock stocks

GBP/NZD Breaks Below The Key Support Of 1.9850

Published 08/31/2020, 06:53 AM
Updated 07/09/2023, 06:31 AM
GBP/NZD
-

GBP/NZD slid on Friday, breaking below the key support (now turned into resistance) zone of 1.9850, marked by the low of August 19th. In our view, the move has signaled a short-term trend reversal, which can be also marked by a short-term tentative downside resistance line taken from the high of August 21st.

That said, in order to start examining lower areas, we would like to see a strong dip below Friday’s low, at around 1.9750. Such a move would confirm a forthcoming lower low and may encourage the bears to pull the trigger, targeting the 1.9620 obstacle, defined as a support by the low of August 6th. They may decide to take a small break after testing that zone, thereby allowing a corrective bounce, but as long as the rate would be trading below the aforementioned tentative downside line, we would see decent chances for another leg south. If this is the case, and the 1.9620 barrier breaks this time, we may see extensions towards the 1.9515 level, marked by an intraday swing low formed on July 30th.

Shifting attention to our short-term oscillators, we see that the RSI rebounded somewhat after testing its 30 line, while the MACD, although below both its zero and trigger lines, shows signs of bottoming as well. Both indicators detect slowing downside speed and suggest that a minor recovery maybe in the works before the next negative leg, perhaps for the rate to test the 1.9850 from underneath, or even the downside resistance line.

In order to abandon the bearish case and start examining whether the bulls have gained the upper hand, we would like to see a strong break above 1.9965. The rate would already be above the downside resistance line, which may encourage advances towards the 2.0130 obstacle, marked by the high of August 25th. Another break, above 2.0130, could see scope for extensions towards the peaks of August 20th and 21st, at around 2.0270.
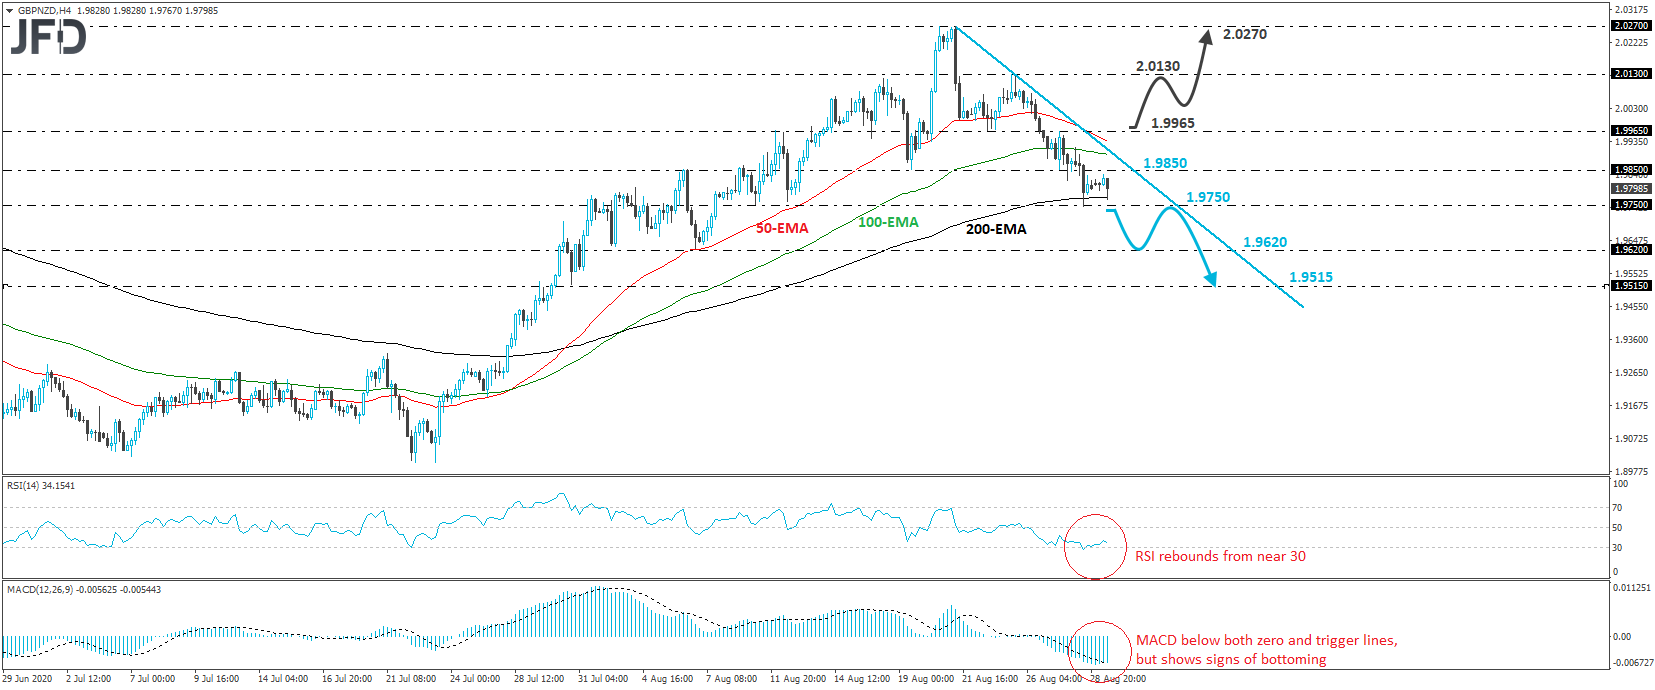
GBP/NZD 4-hour chart technical analysis

Latest comments

Loading next article…
Risk Disclosure: Trading in financial instruments and/or cryptocurrencies involves high risks including the risk of losing some, or all, of your investment amount, and may not be suitable for all investors. Prices of cryptocurrencies are extremely volatile and may be affected by external factors such as financial, regulatory or political events. Trading on margin increases the financial risks.
Before deciding to trade in financial instrument or cryptocurrencies you should be fully informed of the risks and costs associated with trading the financial markets, carefully consider your investment objectives, level of experience, and risk appetite, and seek professional advice where needed.
Fusion Media would like to remind you that the data contained in this website is not necessarily real-time nor accurate. The data and prices on the website are not necessarily provided by any market or exchange, but may be provided by market makers, and so prices may not be accurate and may differ from the actual price at any given market, meaning prices are indicative and not appropriate for trading purposes. Fusion Media and any provider of the data contained in this website will not accept liability for any loss or damage as a result of your trading, or your reliance on the information contained within this website.
It is prohibited to use, store, reproduce, display, modify, transmit or distribute the data contained in this website without the explicit prior written permission of Fusion Media and/or the data provider. All intellectual property rights are reserved by the providers and/or the exchange providing the data contained in this website.
Fusion Media may be compensated by the advertisers that appear on the website, based on your interaction with the advertisements or advertisers.
© 2007-2025 - Fusion Media Limited. All Rights Reserved.