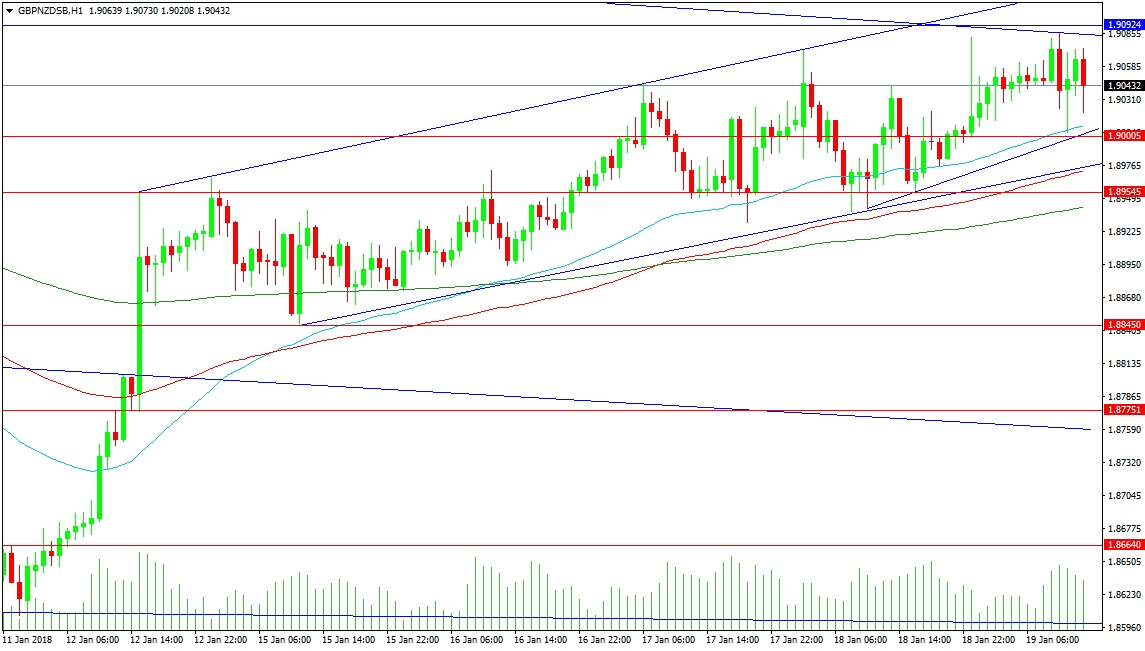
The GBP/NZD pair has formed a rising channel in the 1-Hour timeframe, the bottom of which is supported by the chart’s 3 main moving averages, the 50, 100 and 200-Hour MAs. The area is centred just below the 1.90000 support level and round number, with a weak two-touch trend line close by. The next level of support is at 1.89545, just above the 200-Hour MA. A loss of this targets the low of the week from Monday at 1.88450. Below the 1.88000 level is the previous resistance turned support level of 1.87750, which has a descending trend line close below it. Further support can be found at 1.86640.
Resistance overhead can be found at the descending trend line at 1.90828, with the 1.90924 resistance just above. The rising channel top is located at 1.91211 and continues to gradually rise. 1.92000 can form an area of resistance should price continue to follow the Channel higher.
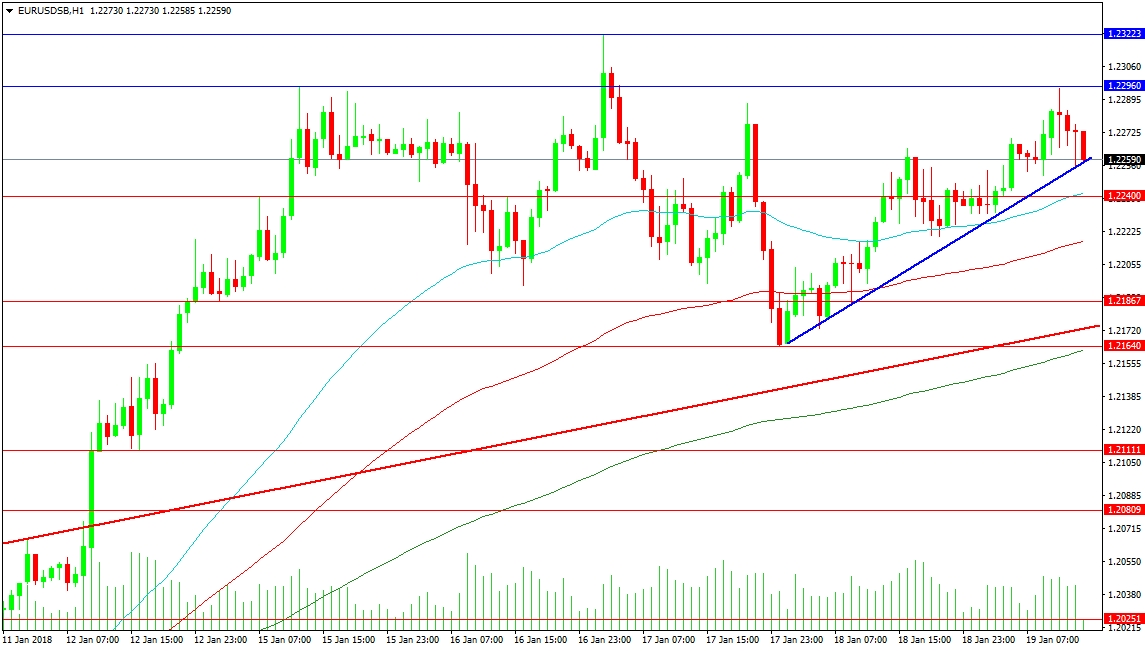
The pair has consolidated sideways this week, forming a range between the 1.23223 resistance level and the 1.21640 support area. So far today, the Blue trend line is acting as support at 1.22590 and should this fail, the price may find support at the Red trend line located at 1.21740, close to the 200-Hour MA which is rising nearby. Support below here can be found at 1.21111, followed by 1.20809. The 1.20250 level is the last support before the 1.20000 round number.
Resistance for today is at the day’s high of 1.22960, close to the 1.23000 round number and part of its zone of control, the same level that provided resistance early on Monday. This is followed by the week’s high as mentioned above.


