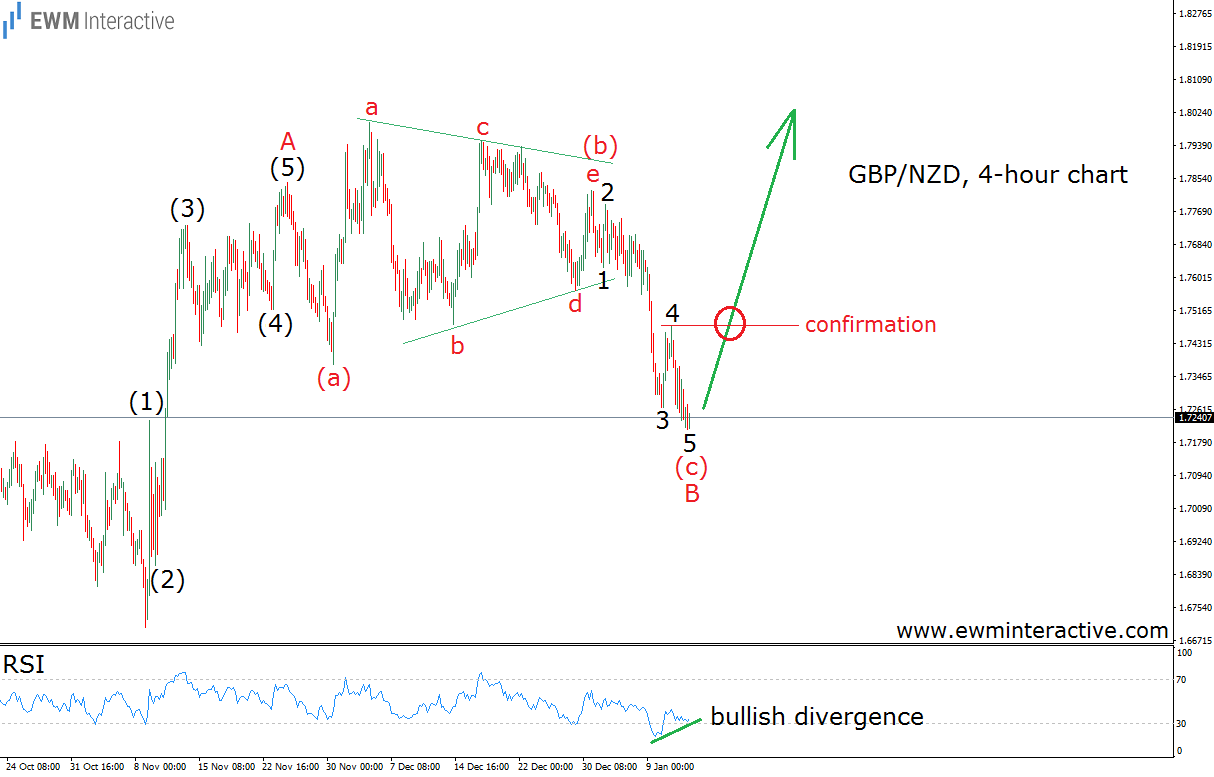
GBP/NZD almost reached 1.8000 a month ago, but the bulls ran out of fuel a fraction of a pip lower. Then the bears took the torch to drag the pair as low as 1.7212 as of today. However, instead of selling after e decline of almost 590 pips, we believe the buyers are ready for another attempt to conquer 1.8000. And this time chances are it is going to be a successful one. The chart below explains why.
According to the Elliott Wave Principle, we can identify the direction of the larger sequence by simply spotting a five-wave impulse on a chart. It looks like that GBP/NZD rose in impulsive manner between 1.6704 and 1.7844. But every impulse is followed by a three-wave correction before the trend resumes. And that is where things usually get complicated, because identifying the exact type of the retracement can often be tricky. In this case, GBP/NZD seems to have drawn a confusing type of flat correction, because its wave B looks like a triangle. Nevertheless, it is still just a three-wave pattern, which, once over, should give the start of the next positive phase – wave C up. Furthermore, the relative strength index shows a bullish divergence between waves 3 and 5 of (c) of B – another sign that the bears might be ready to give up. Of course, it is never a good idea to try picking bottoms. The better approach would be to wait for the top of wave 4 of (c) of B to be taken out before joining the bulls, because such a breakout will not only serve as a confirmation of the bullish reversal, but it will also provide a concrete stop-loss level right below the bottom of wave 5 of (c) of B. Until then, GBP/NZD might continue to decline, but as long as 1.6704 holds, the bulls’ ambitions should not be underestimated.
