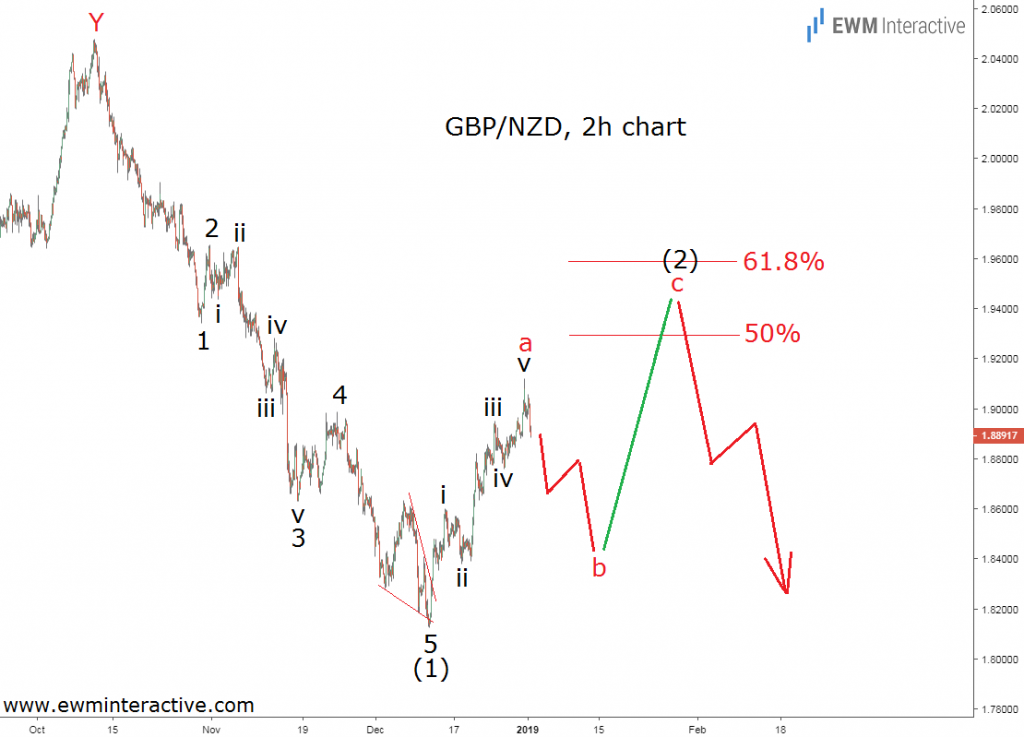
Three weeks ago, GBP/NZD was hovering around 1.8900, but the Elliott Wave principle suggested the recovery from 1.8125 was “far from over.” A three-wave pullback was supposed to occur, followed by another rally towards the resistance area between 1.9250 – 1.9630. The chart below, published on January 2nd, explains.

The recovery from 1.8125 looked like a five-wave impulse in wave “a” of (2), labeled i-ii-iii-iv-v. It followed an even larger impulse pattern from 2.0470 to the south, marked as wave (1).
According to the Wave principle, a three-wave correction occurs after every impulse. Since wave “a” was a five-wave pattern, we thought it was just the first phase of a larger a-b-c zigzag correction in wave (2). A pullback in wave “b” and another rally to a new high in wave “c” were supposed to develop before wave (2) ended.
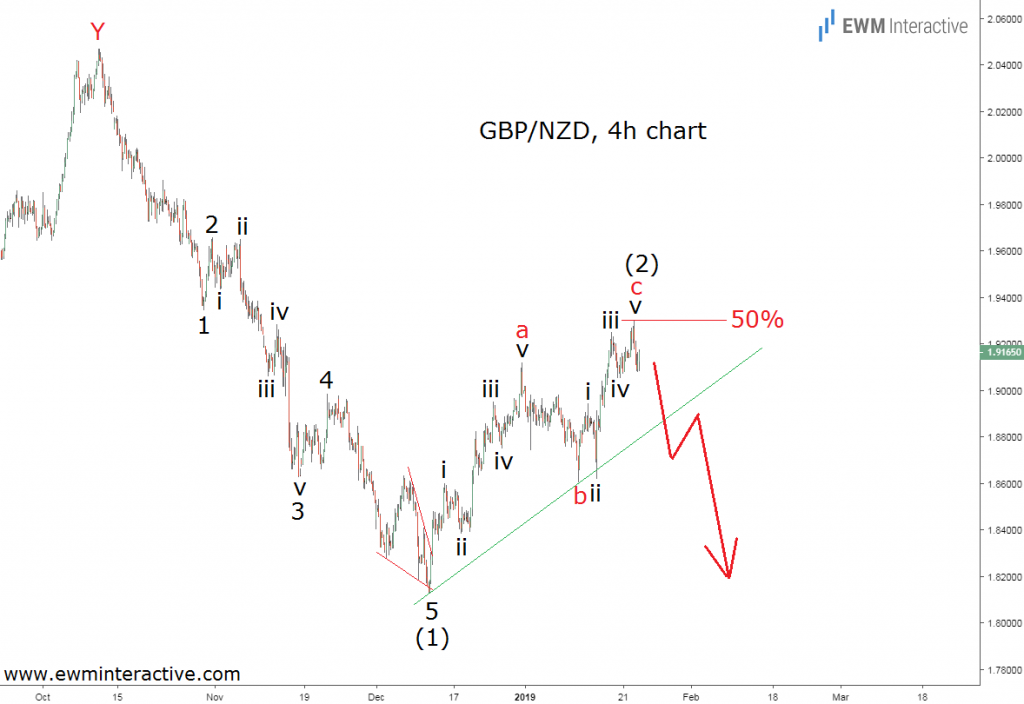
Yesterday, the pair climbed to 1.9299, so now is a good time to take another look.

Wave “b” dragged GBP/NZD down to 1.8602 on January 11. Then, the bulls took the wheel and drew a five-wave impulse in wave “c” up to 1.9299 eleven days later. If this count is correct, the 5-3 wave cycle from the top at 2.0470 is complete. The trend should now resume in the direction of the impulsive sequence.
Wave (2) just touched the 50% Fibonacci level, but the dip from 1.9299 is still too small and cannot confirm the resumption of the downtrend. Traders should wait for a breach of the support line drawn through the lows of waves (1) and “b” of (2) before joining the bears in GBP/NZD.
