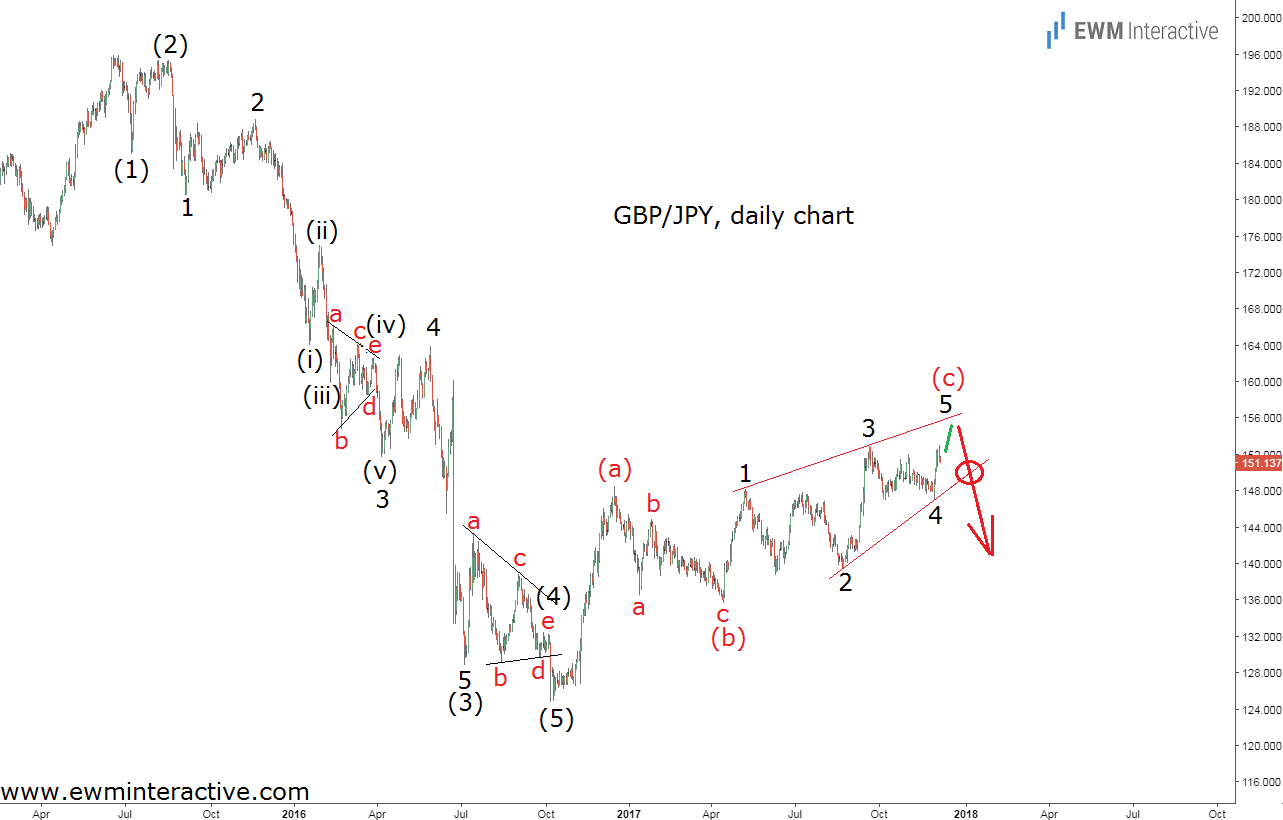
GBP/JPY climbed to its highest point in over a year yesterday, despite Brexit negotiations not going in the best possible way. The pair has been in recovery mode since October 2016, but its chart is looking quite heavy, not because we expect Brexit to eventually take its toll on Britain’s economy, which is also very likely, but because there is an Elliott Wave pattern that spells trouble over its currency. Take a look at it below.

It is a combination of patterns actually. First, there is a five-wave impulse to the downside from 195.89 to 124.69. The structure of wave 3 of (3) is interesting, because one part of wave (iv) overlaps the bottom of wave (i). Under normal circumstances, this is a violation of the rules, but in that case, wave (iv) is a triangle, whose orthodox end is wave “e”. Wave “e” does not overlap wave (i), so there is no violation of the Elliott Wave Principle’s rules.
Naturally, the impulsive decline was followed by a three-wave corrective recovery to 152.95 so far, which seems to be almost over, thus completing the entire 5-3 cycle. The corrective rally takes the shape of an (a)-(b)-(c) simple zig-zag retracement, whose wave (c) looks like an ending diagonal. That is the pattern, which is most worrisome, because according to the theory, ending diagonals are followed by a “swift and sharp reversal.”
If this count is correct, GBP/JPY is already searching for a top. However, the bearish reversal would only be confirmed, if we see a breach of the lower line of the ending diagonal wave (c). Until then, the bulls remain on the wheel.
