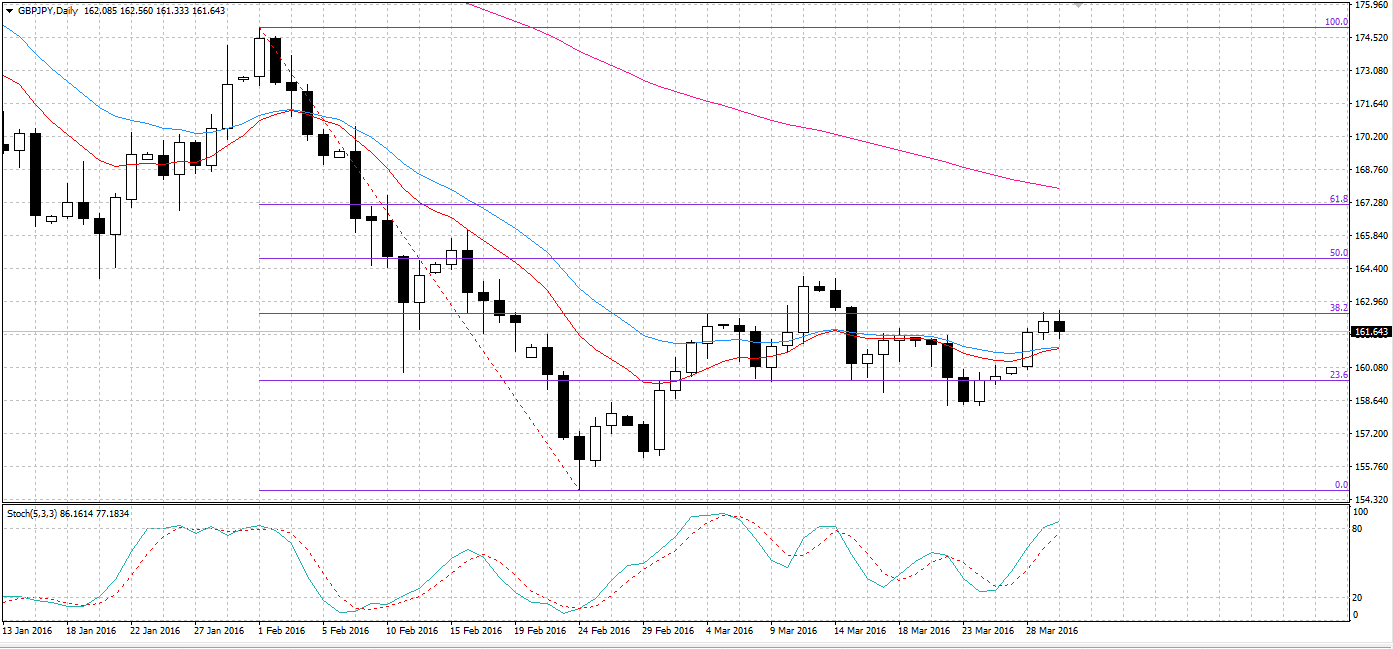
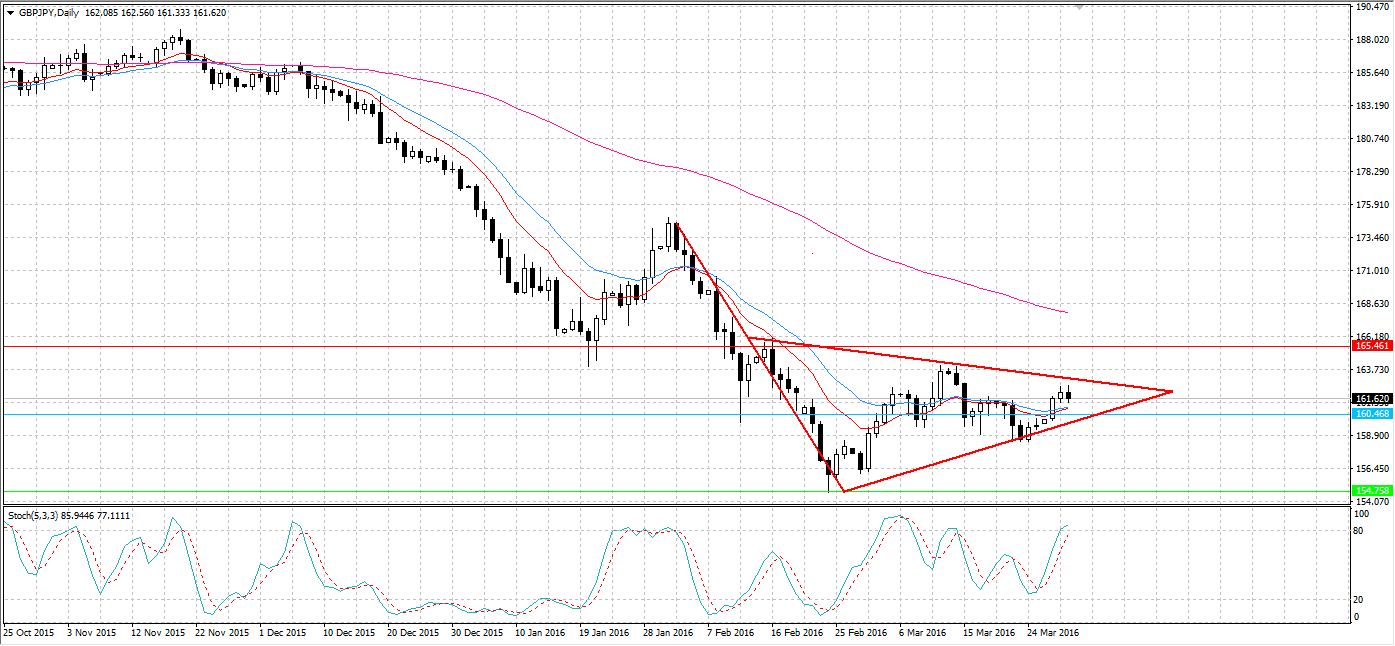
The anaemic pound looks to be setting up for yet another tumble against the Yen. With the general atmosphere of scepticism towards the UK economy, the GBP has seen itself sliding against most currencies in the past few weeks. In January the GBPJPY took a major dive from the lofty heights of 174.87 to the low of 154.75. In subsequent weeks, the bulls eventually managed to fight back and recover some of the losses. However, the bears are not done yet and could now be poised to have another go at the 154.75 support.
As the daily chart demonstrates, the GBPJPY has remained relatively constrained within two Fibonacci retracement levels and has flattened out the 12 and 20 day EMAs. Afterthe pair recently tested resistance at the 38.2% Fibonacci retracement, it is now moving back to test its support at the 23.6% level. Additionally, the Stochastic Oscillator reading currently indicates the pair is overbought and this should fuel further selling pressure.

In addition, a consolidation pattern appears to be forming and this bearish pennant could send the pair into another free fall. As shown in the below daily chart, the pennant is still awaiting some pattern completion. However, the Fibonacci resistance and support levels should ensure the full pattern forms over the next number of days. This particular pattern is indicative of a potential downside breakout and bears should be keeping watch as the pattern draws closer to completion.

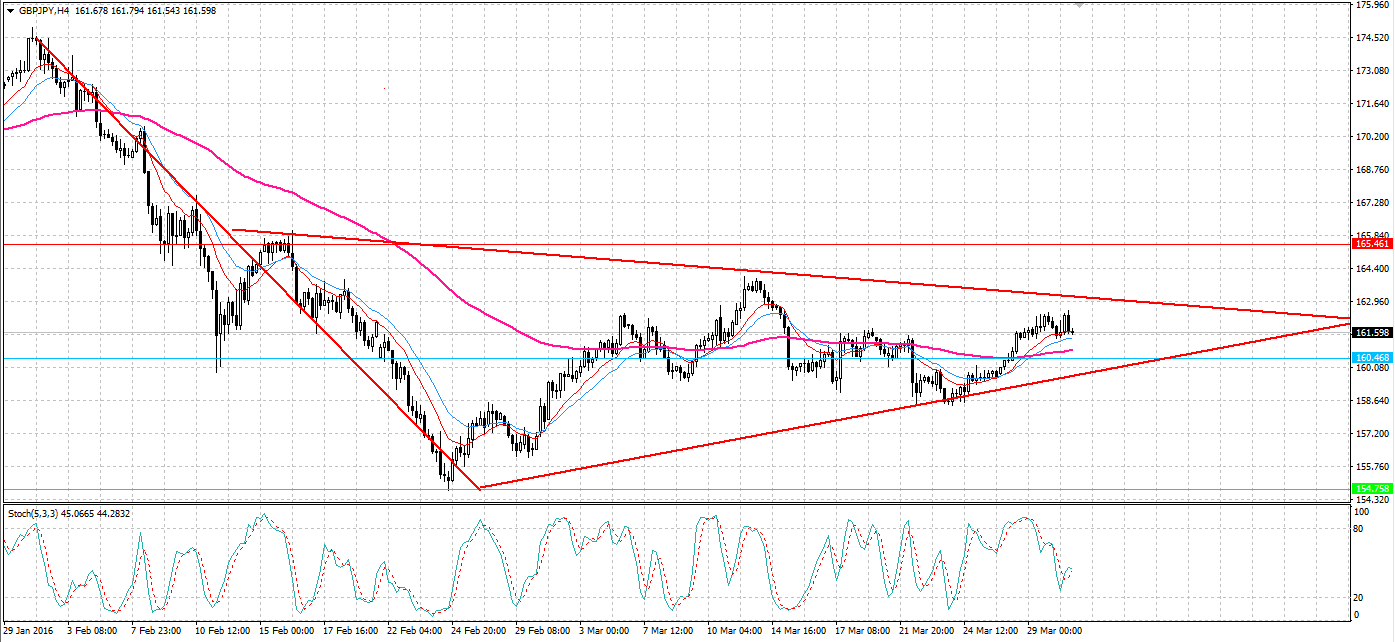
We can look at the H4 chart to confirm that the pair’s current pattern is a bearish pennant and not a falling wedge. As shown, the 100 day EMA (pink) is now moving in a sideways fashion and not downwards. This confirms the bias that this is indeed a pennant and not what some may argue to be a falling wedge. The distinction is important here as the falling wedge would usually precede an upside breakout and not the desired downside action.

While the downside breakout is likely to result in a significant fall, I wouldn’t be expecting it to go much below the 154.75 level where support was recently found. As the pair is already relatively low, there is room to move but not to the same degree we saw at the start of February. The 154.75 support is fairly robust and breaking it will require some exceptional circumstances in the next few weeks.
Ultimately, this pattern could be upset by any surprise economic results coming out of the UK or Japan in the coming week. Ideally, the UK will continue its recent trend of posting poor GDP growth results and put selling pressure on the pair.In contrast, it is hoped that Japan’s Tankan manufacturing and non-manufacturing resultsexceed expectations. The positive Japanese result will compound any downwards pressure being exerted after another poor UK GDP result.However, keep a close eye on the news as the pattern comes closer to completion to avoid being caught out by any shock movements.

by Matthew Ashley
