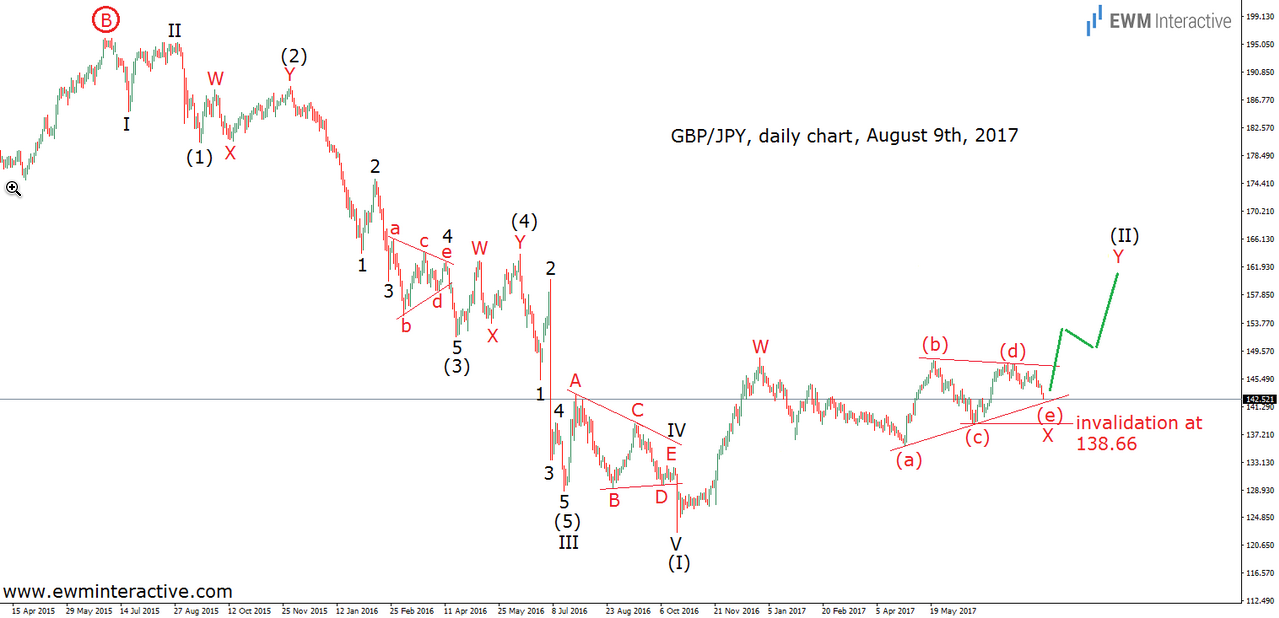
Despite the fact that volatility drops significantly during the summer, obviously not everyone was on vacation, because on August 9 we received an on-demand order to make an Elliott Wave analysis of GBP/JPY. Back then, the pair was hovering around 142.50 and has been moving sideways between 148.50 and 135.60 for more than half a year. So we rolled up our sleeves and got to work. The analysis we came up with included the following daily chart of GBP/JPY.

Impulse Pattern
The daily price chart revealed a five-wave impulse pattern between 195.87 and 122.64. According to the theory, every impulse is followed by a correction of three waves in the opposite direction. This led us to conclude that the whole price development from the bottom at 122.64 was part of corrective recovery, most probably a W-X-Y double zig-zag with a triangle in the position of wave X. This, in turn, suggested that as long as GBPJPY traded above the bottom of wave (c) of X, the bulls were supposed to lift the exchange rate even higher in wave Y of (II). September is almost over now so it would not hurt to see how this prediction has been developing.

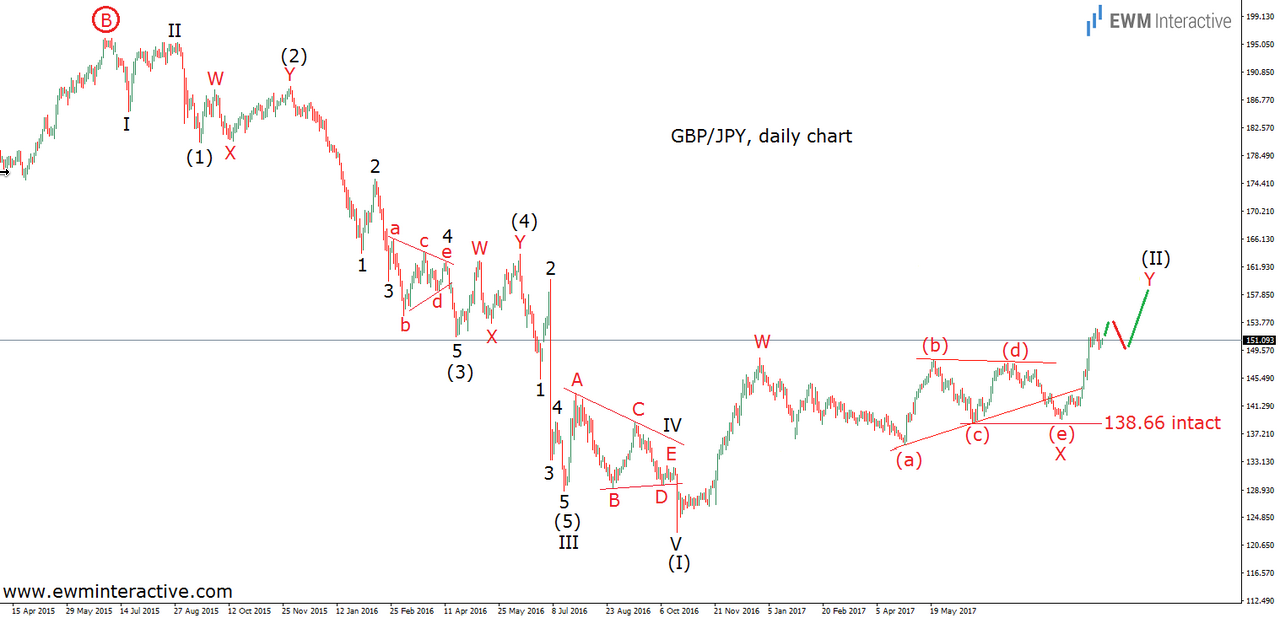
GBP/JPY initially fell to 139.30 in wave (e) of X on August 20. However, instead of continuing to move south, it reversed to the upside again, preserving the positive outlook, since the invalidation level at 138.66 survived. From then on, GBP/JPY’s fate was at the mercy of the bulls, who did not waste time. Last week, the pound finally breached the range and climbed to 152.85 against the Japanese yen. The question of what to expect from now on logically follows. Let’s dive deeper into the wave structure of the recent rebound from 139.30.
Rebound Wave Structure

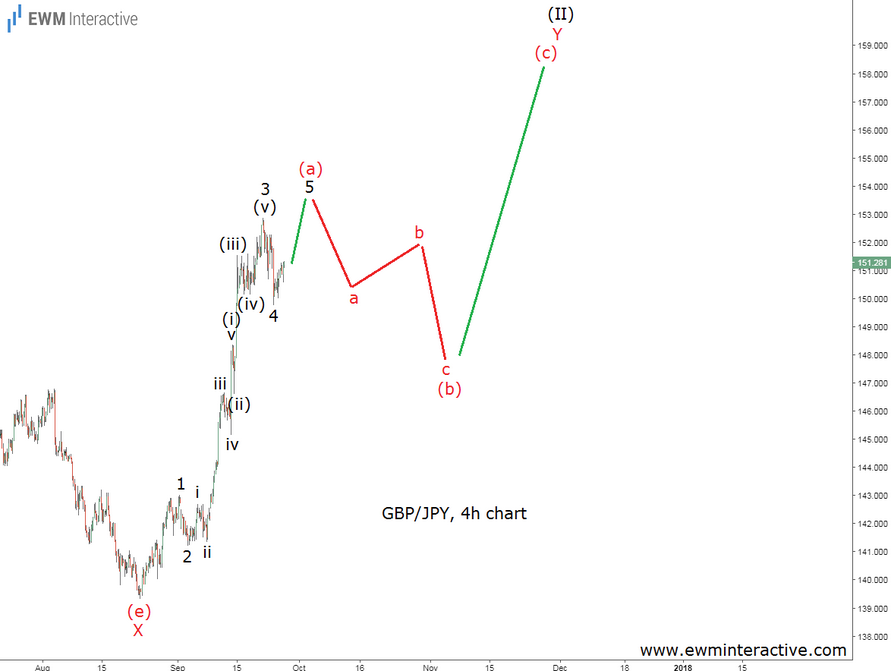
The advance in question looks like an incomplete impulsive pattern, because its wave 5 is still missing. Nevertheless, due to the fact that wave 4 seems to have found support near the termination are of wave (iv) of 3, we believe wave 5 should soon achieve a new multi-month high, possibly exceeding 153.00 and completing wave (a) of Y. Then, instead of buying the breakout, traders would be wise to stay aside and wait for a notable three-wave decline in wave (b) to occur, before the bulls return in wave (c). The support zone between 147.00 and 148.00 should provide buying opportunities with a much better risk/reward ratio.
