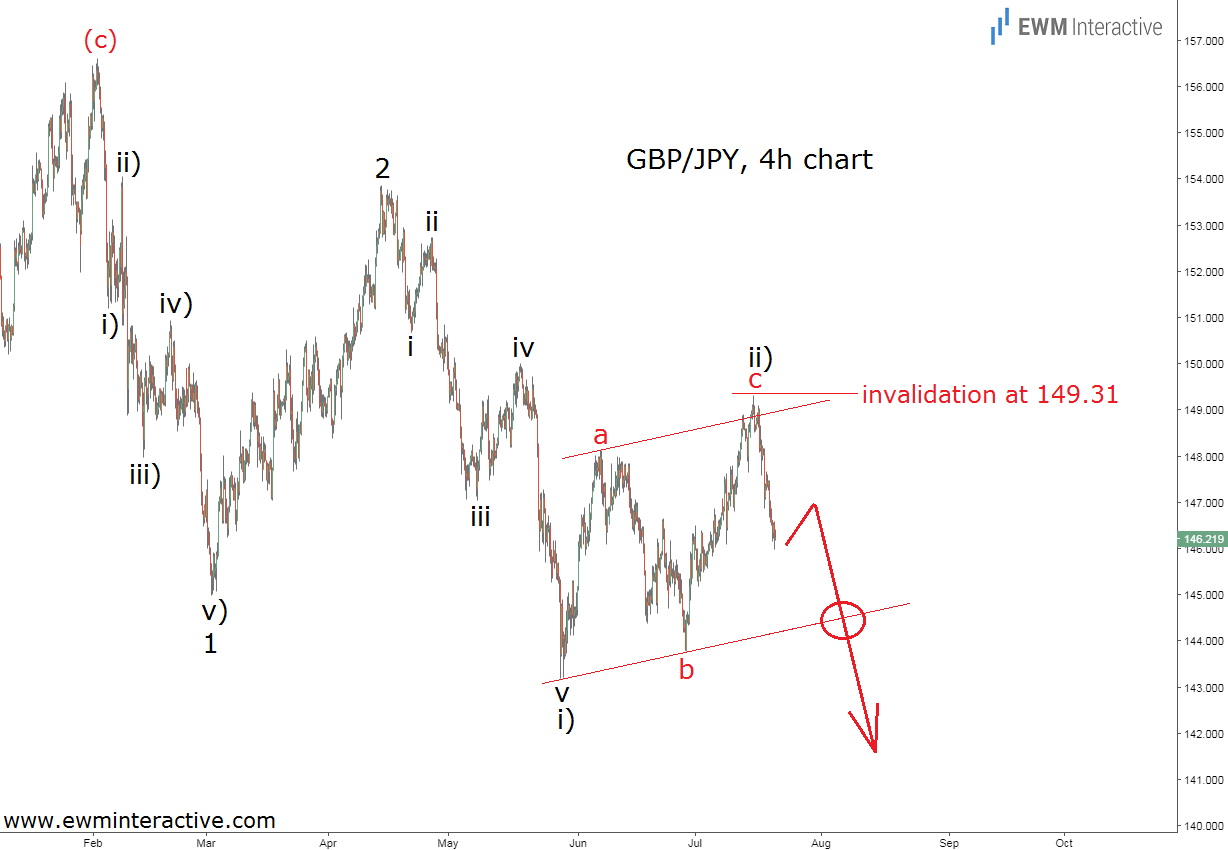
It has been less than 20 days since our last update on GBP/JPY. On July 20th we shared our view that the pair is “looking into the hard Brexit abyss” and while the pair was trading around 146.20, we concluded that much lower levels should be expected. Of course, the bearish outlook was not based on Mark Carney‘s statements or the rising probability of a hard Brexit. Instead, we went with the chart below and its Elliott Wave implications.

The 4-hour chart of GBP/JPY revealed two textbook five-wave impulses in waves 1 and i), each followed by a three-wave recovery in waves 2 and ii), respectively. According to the theory, impulses point in the direction of the larger trend. In addition, the big picture outlook was not giving the bulls a lot of reasons for optimism, as well. The takeaway was that as long as GBP/JPY traded below the high of wave ii) at 149.31, the bears were going to remain in charge. The lower line of the corrective channel wrapped around wave ii) looked like their first major obstacle on the way down. “No problem” they said.

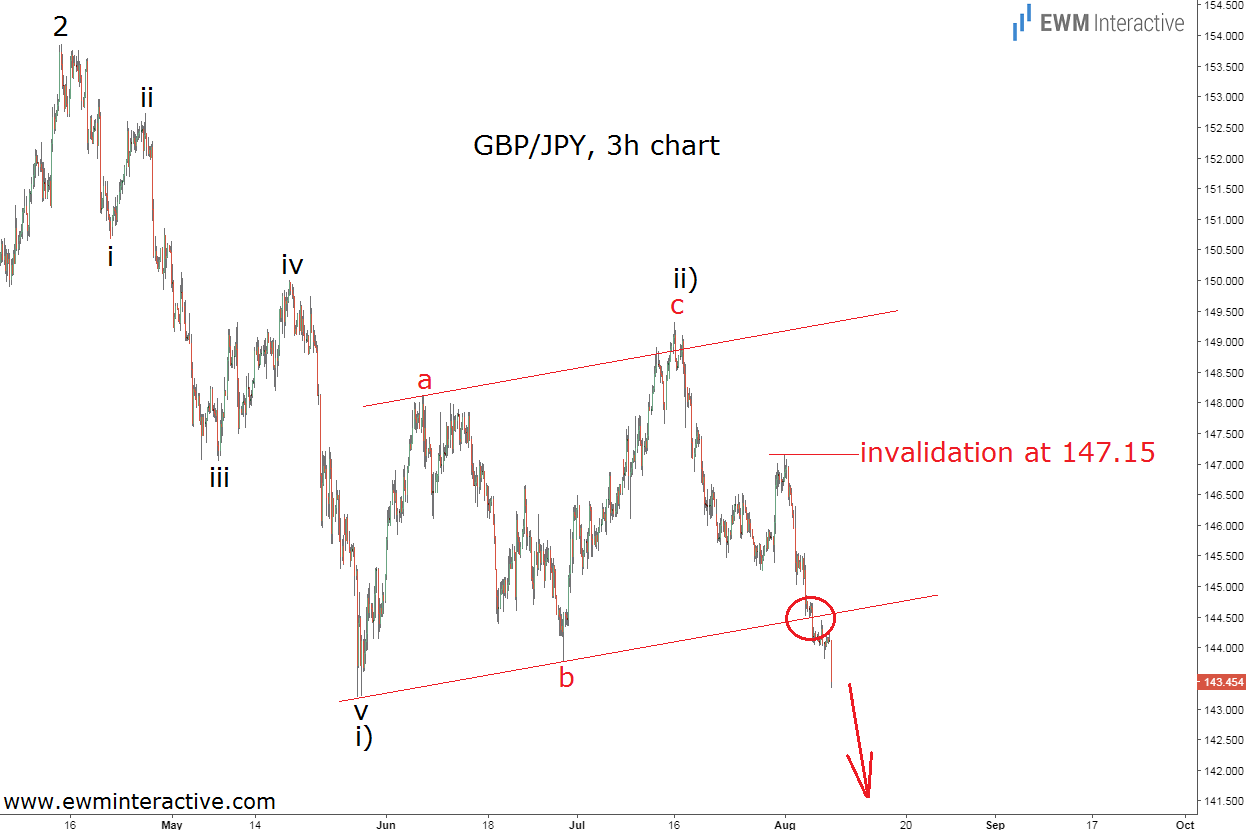
GBP/JPY breached the lower line of the channel on August 6th and continued to the south. As of this writing, the pair is approaching 143.20 – a level not seen in almost a year. The recent developments allow traders to move the invalidation level from 149.31 down to 147.15 and maintain the negative outlook. Given that third waves are usually the largest and fastest part of the Elliott Wave cycle, we believe the worst is yet to come and 2018 is going to be a very bad year for GBP/JPY longs. 120.00 is there for the taking in the long-term.
