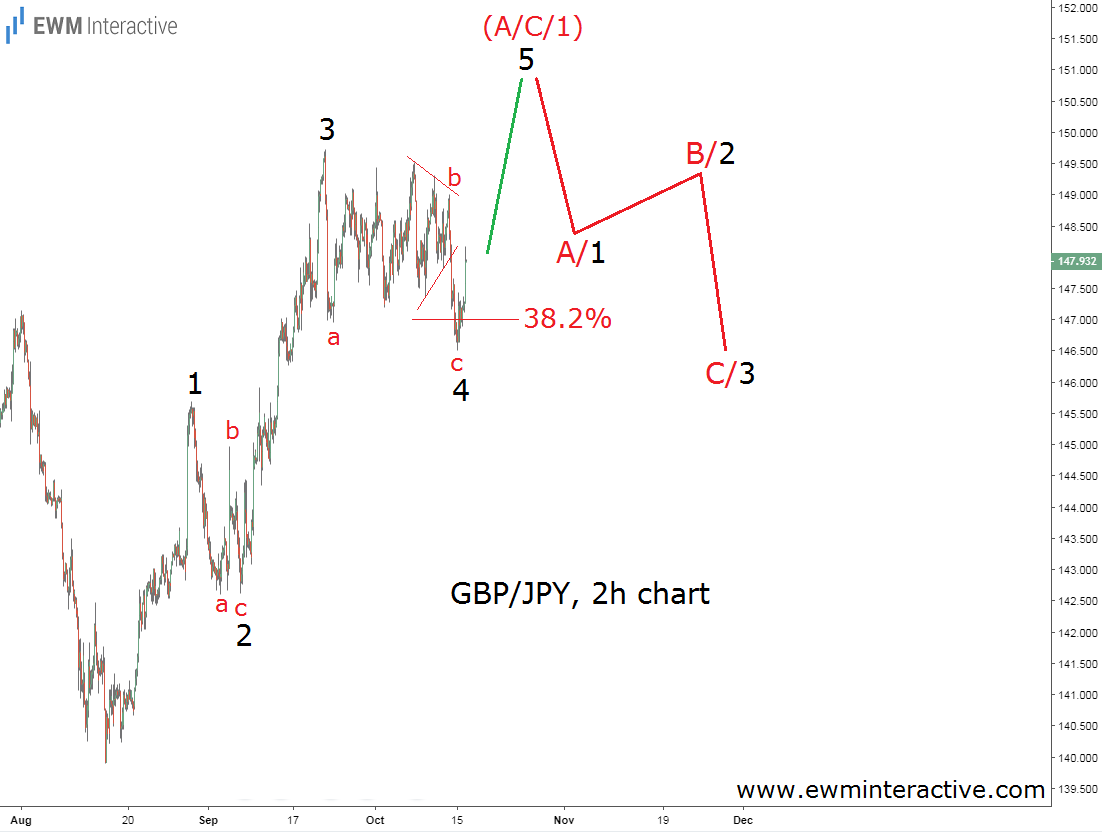
GBP/JPY has been in recovery mode since it touched 139.90 on August 15th. On September 21st, the pair climbed to a multi-month high of 149.72, but fell to an intraday low of 146.51 yesterday. As of this writing, the Pound is hovering around 147.90 against the Japanese yen. The time is appropriate to apply the Elliott Wave Principle on GBP/JPY’s 2h chart below and see what can be expected in the near future.
The chart reveals the structure of the pair’s rally from 139.90. So far, it has only drawn the first three waves of a five-wave impulse. However, we suspect that a complete five-wave pattern is going to form, because of the structure of the recent pullback to 146.51. It looks like a simple a-b-c zigzag with a triangle in the position of wave “b”.
Corrections only temporarily interrupt the larger trend, which means GBP/JPY is still under the bulls’ jurisdiction. In addition, today’s sharp bounce comes shortly after the pair met the support of the 38.2% Fibonacci level, which is a typical termination level for a fourth wave within an impulse pattern.
What this means for GBP/JPY?
If this count is correct, we can expect more strength towards 150.00 – 151.00 in GBP/JPY. On the other hand, the theory states that a three-wave correction follows every impulse. This means the bears are likely to try and drag it back down to 146.00 as soon as the pair exceeds 150.00.
The bigger picture allows us to label this entire five-wave sequence as wave (A), (1) or (C). It is too early to say which is the correct labeling, but a pullback at least to the support of wave 4 can be expected in all three alternatives once wave 5 is over.
In conclusion, the bulls remain in charge for now, but are likely going to pass the torch to the bears somewhere between 150.00 and 151.00.
