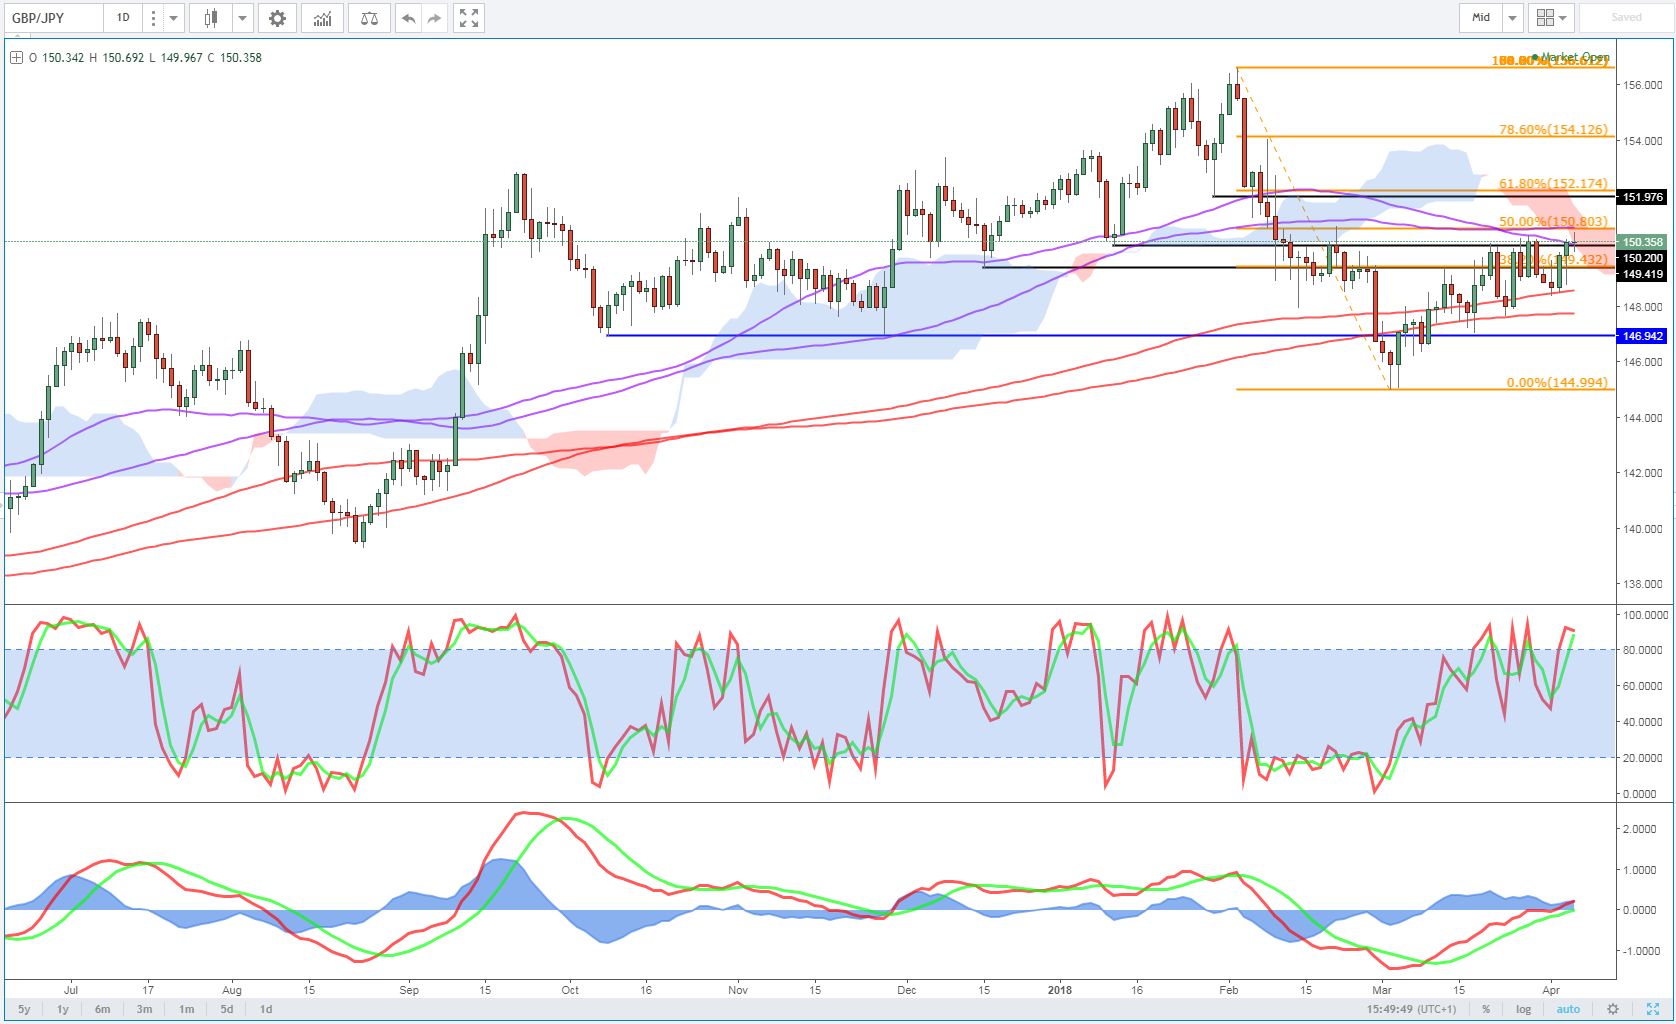
GBP/JPY is trading at a very interesting level right now. After breaking below the ichimoku cloud and 55/89-day simple moving average combination two months ago, the pair continued to take out support after support with relative ease, creating quite a bearish outlook in the medium term.
Recent Resistance
The last month has seen the pair trim some of those losses and we now find ourselves at a key level. Price has run into resistance over the last week between 150.00 and 151.00, where the 55/89 DMAs once again cross the ichimoku cloud, something that did not end well last time. The fact that this combines with the 50 fib level – February 2 swing high to March 2 swing low – makes this an increasingly noteworthy level.

This time, though, rather than powering through them, the rally has stalled and the momentum indicators don’t give the impression of a pair that’s about to break down the barriers right now. While oscillators are not a primary indicator – that will always be price – a divergence between price action and the stochastic and MACD can be a useful signal of an impending bias shift. For the last month, the trend has been nicely bullish, but is that about to change?
From a technical standpoint, a rotation off the current level would be very bearish. Aside from signaling a continuation of the medium term bearish move, it would also act to confirm the initial breakout.
None of this is to say price can’t and won’t break above here. And if it did, that would be quite a bullish signal. The important thing is we should get a clear indication of whether the market is bearish or bullish very shortly. As it stands, the pair looks bearish and the break of the 200/233 DMAs last month supports that (although it did turn out to be a false breakout back in August).
