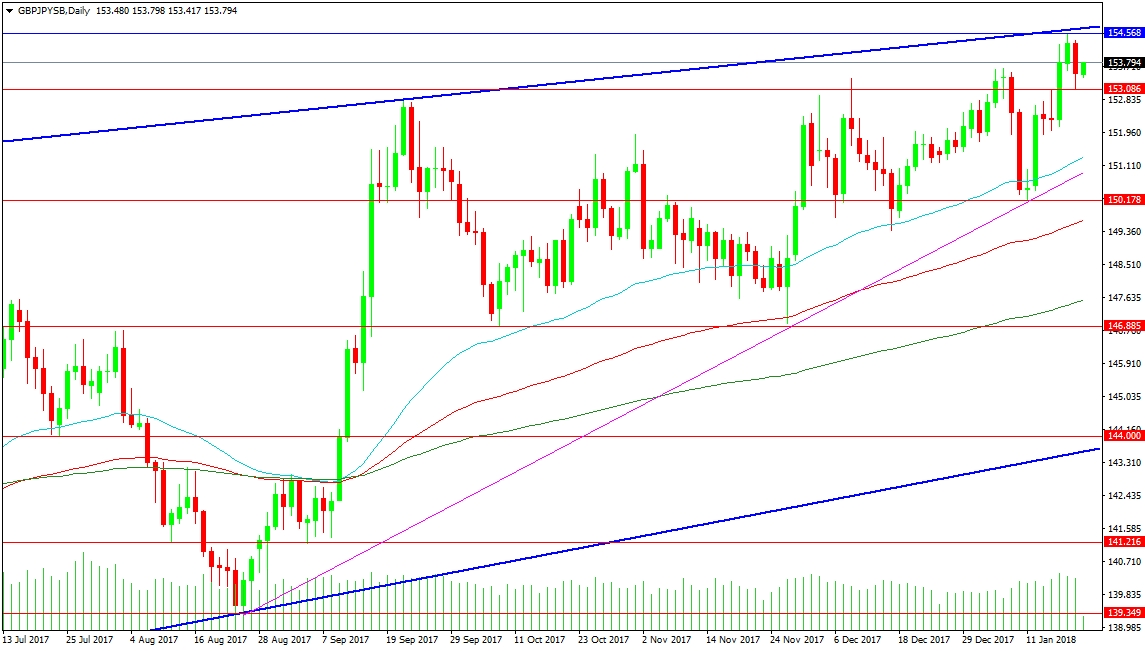
The GBP/JPY currency pair has been gaining ground steadily since its low in autumn 2016. It has now reached a resistance level from late February of that year when a selloff in the market paused and a steep downtrend put in a minor low at 154.700. On the current Daily chart, this level corresponds with the Channel top, in blue. The high reached so far is 154.568, with immediate support at 153.086, the low from Friday. With the Bank of Japan Interest Rate Decision on Tuesday morning at 04:00 GMT, the nearby technical level may be tested beyond breaking point.
The rising support trend line from August is located at 150.904, with the 151.000 level just above and the 50-Day MA at 151.306. The other major moving averages are below this area, with the 100-Day at 149.667 and the 200-Day at 147.558. There is a key level of support at 146.885, with a loss below here creating a major Daily low and a pretty clear run to the next support at 144.000 and the rising channel bottom.
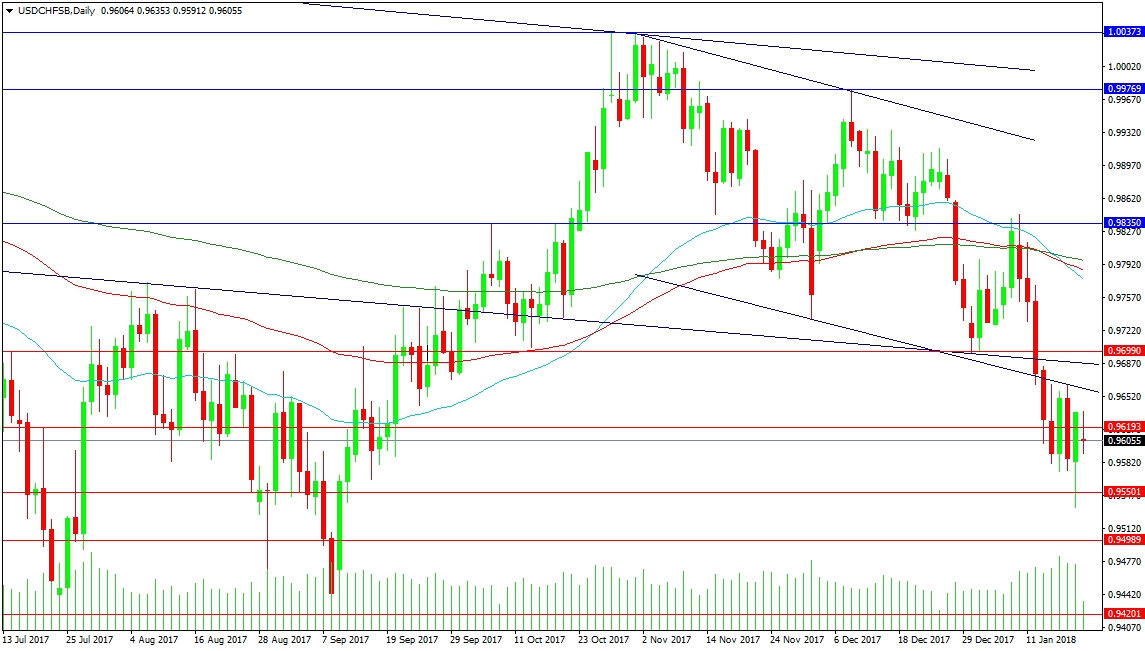
The USD/CHF pair has moved lower under the important support at 0.96990. This was a crucial level because a new lower low has been created with the loss of the supporting trend line at 0.96700. The new low can be found at 0.95345. Support below can then be found at 0.94989. The low from September is located at 0.94201, which would be targeted if a new subsequent lower low is now created.
The Chart did look like it was creating a Bull flag but Dollar weakness pushed the price below the pattern. The bottom of the channel was tested as resistance on Thursday. Should price try to get back inside the channel and bounce from the trend lines around 0.96800, a move higher is needed to test the resistance at 0.98350, before a retest of the channel top at 0.99265 and the subsequent overhead trend line at 0.99978. A break above here would essentially be a test of parity at 1.00000 and then 1.00373.


