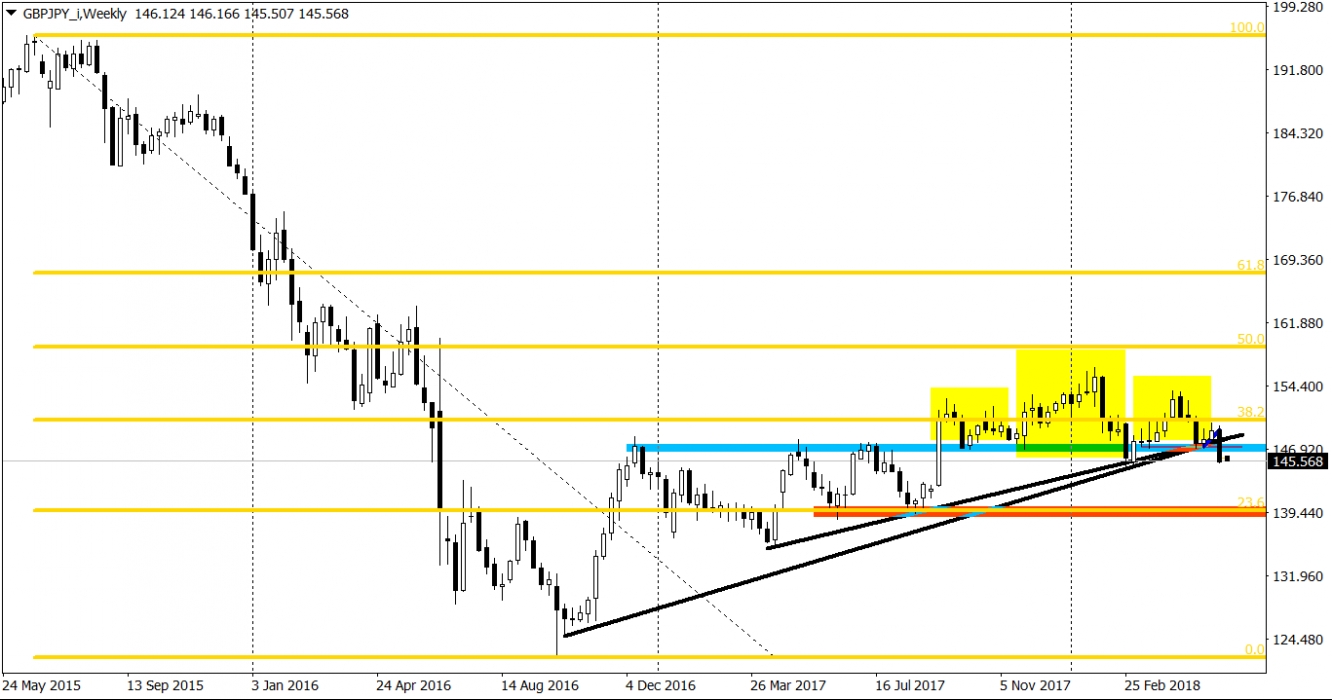
In trading, you always need to chase the probabilities, leaving the possibilities behind. Everything is possible, so it is not what you should focus on. What a trader has to do is analyse the chart and estimate the chances of the price going up or down. It does not really matter, which path you follow, sometimes you are able to spot such a sweet deal that it can be a shame not to trade it. Sometimes the chart is saying one thing: SELL ME! According to the price action laws, that is the current situation on the GBP/JPY.
Sell opportunity on the GBP/JPY is only for the patient, long-term traders. Setup can be found on the weekly chart and has everything that is needed to go short. First of all, we do have a long-term downtrend. What is more, we just finished a bullish correction. We know that we finished that because the price created a trend reversal pattern (head and shoulders, yellow rectangles) and because of the fact that the GBP/JPY additionally broke two up trend lines (black). Furthermore, the price fell below the 38.2% Fibonacci level and broke the horizontal support around the 147.5 (blue). As You can see, the bears are winning on every front, which leaves no other way than south.
The target for this drop is on the red area around the 139.2. That is the next crucial Fibonacci line (23.6%) along with the lows from the June and August, 2017. When looking at the candle from the last week, which is a bearish marubozu, we can estimate that the chances of getting there are very high.

