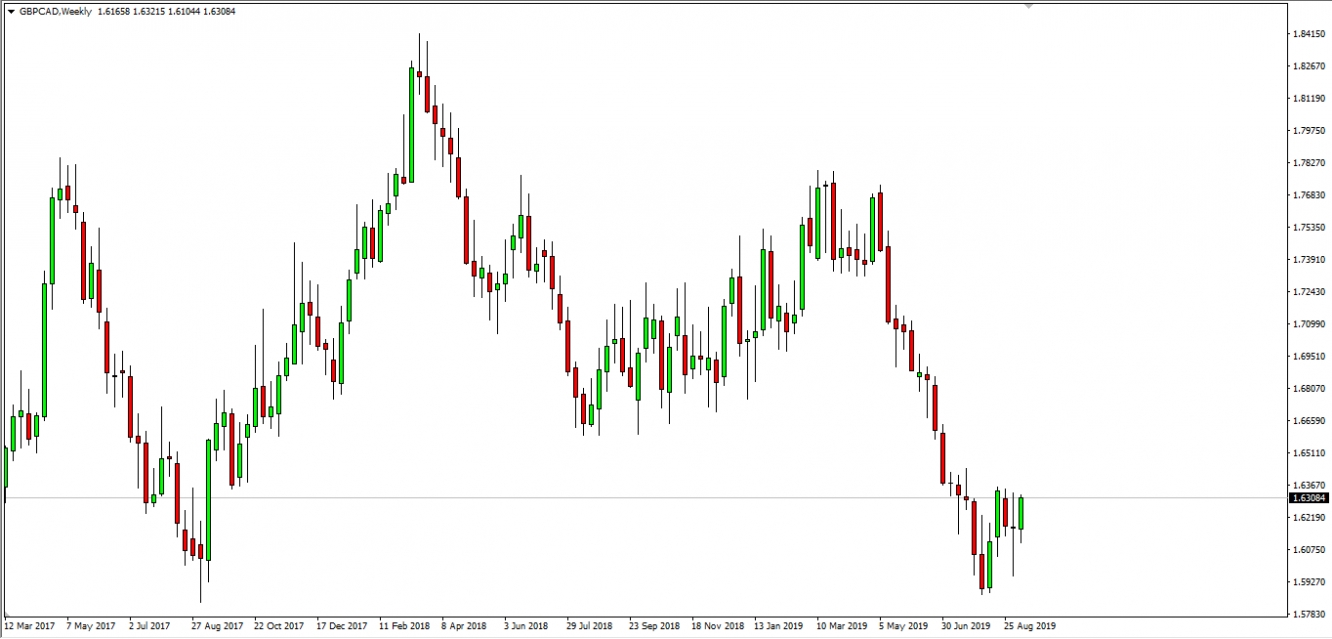
GBP/CAD finally stopped it’s 5-month fall and bottomed out at 1.58700. By doing this it broke a major psychological area at 1.66000. Currently the bears are taking a breather and the bulls are attempting to regain some ground.
Here is how the clean chart looks like on the weekly time frame, where this setup is spotted from a technical point of view.

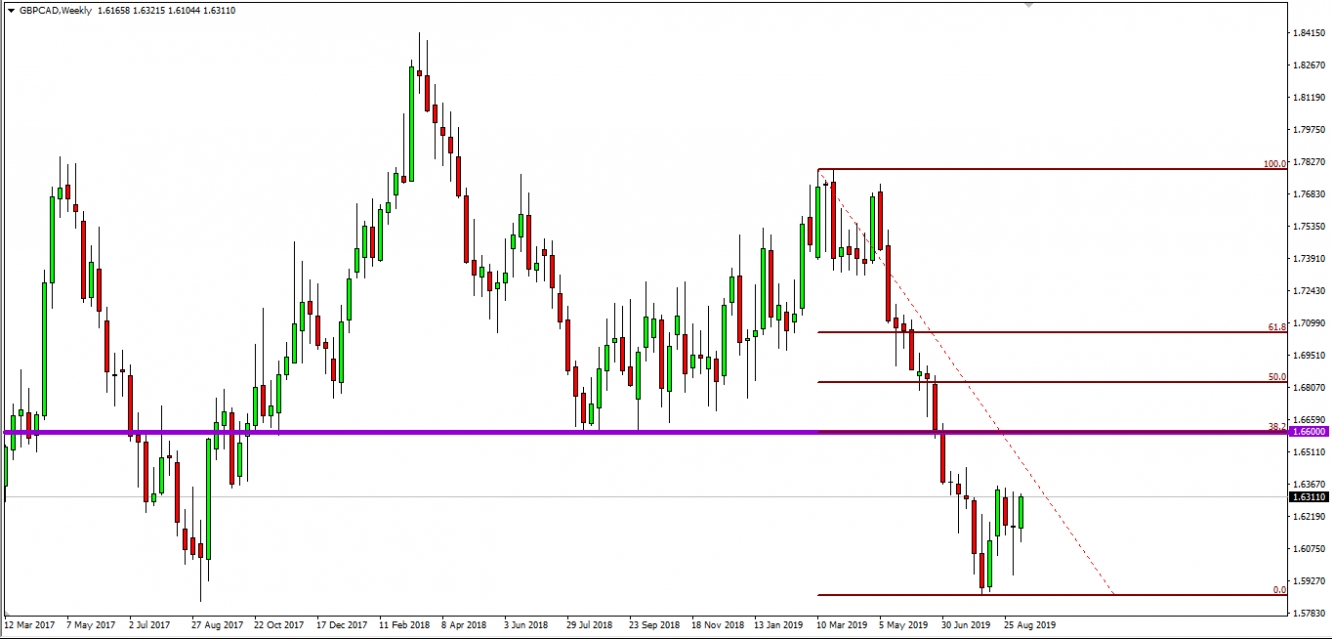
After we mark the major infliction point 1.66000, we can clearly see that the Fibonacci area of 38.2% falls to the pip on the 1.66000 level.

Potential Scenario: What I would like to see happen from now on, is for price to retrace at the aforementioned area, and give us a price (candlestick) formation we can actually trade.
I am not going to be trading any breakout to the upside, since it’s obvious from just a quick look at the chart that the bias is towards the downside. We are looking for a bounce either as a direct touch of the 1.66000 area, or a fake breakout formation – either one would be equally valid.
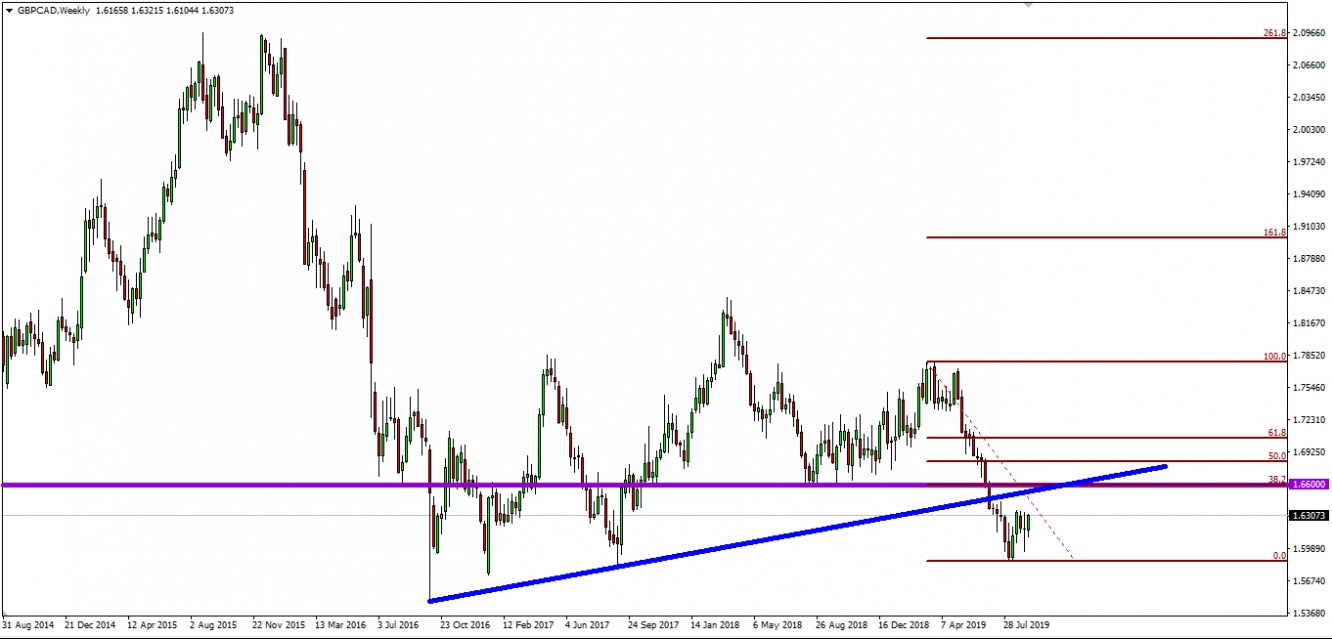
As an added bonus of this confluence of resistance that price is facing, if we zoom out just a little bit more, we can clearly spot a very mild rising trendline that has been broken, and when we expand this trendline it falls in the area where price is expected to have some kind of a reaction, if it gets there at all of course.

Courses of action: I am looking for 3 specific candlestick formations
- Pinbar (Reverse Hammer)
- Railway Tracks
- Outside Bar
If we get one of these formations, I will be all over this setup!
Profit projections:
There are a few ways we can go about exiting this setup. One thing that I am sure of beforehand is that I will have a sequential target policy as always.
The target levels will depend on what type of a reaction we are going to get initially.
What do I mean by this?
- If we get a very strong reaction candle, we are going to exit 50% of our lot size upon the close of the first candle, and another 50% upon the close of the second reaction candle, because more times than not, there is enough volume for a second push, which is not as quite as long as the first one. Because of this, we cannot set up specific levels of exiting.
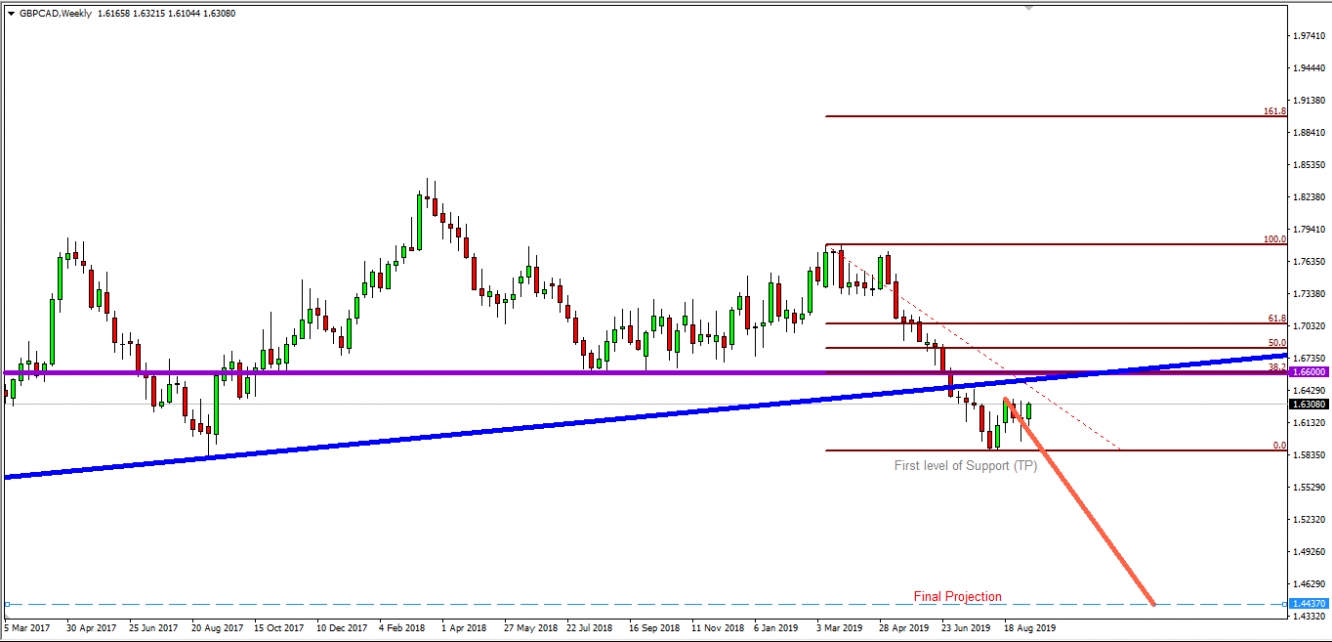
- On the other hand if we get a milder reaction, and price is struggling to push to the downside, but the bears are obviously regaining control, then we can exit at the first level of support which is going to give us a really healthy R:R.
- And if you want to squeeze the full potential of this setup, then you can measure the entire length of the swing to the downside and project it to the tip of the retracement when it finishes. This is going to give you a potential of more than 1900 pips, which is ridiculous, and is going to take more than 5 months for price to get to that point.

Final Thoughts:
Whatever happens, we need to make sure that we are practicing solid risk & money management, because the markets owe us nothing - and trading (investing) is not only about skill, but also about probability, statistics and etc.
