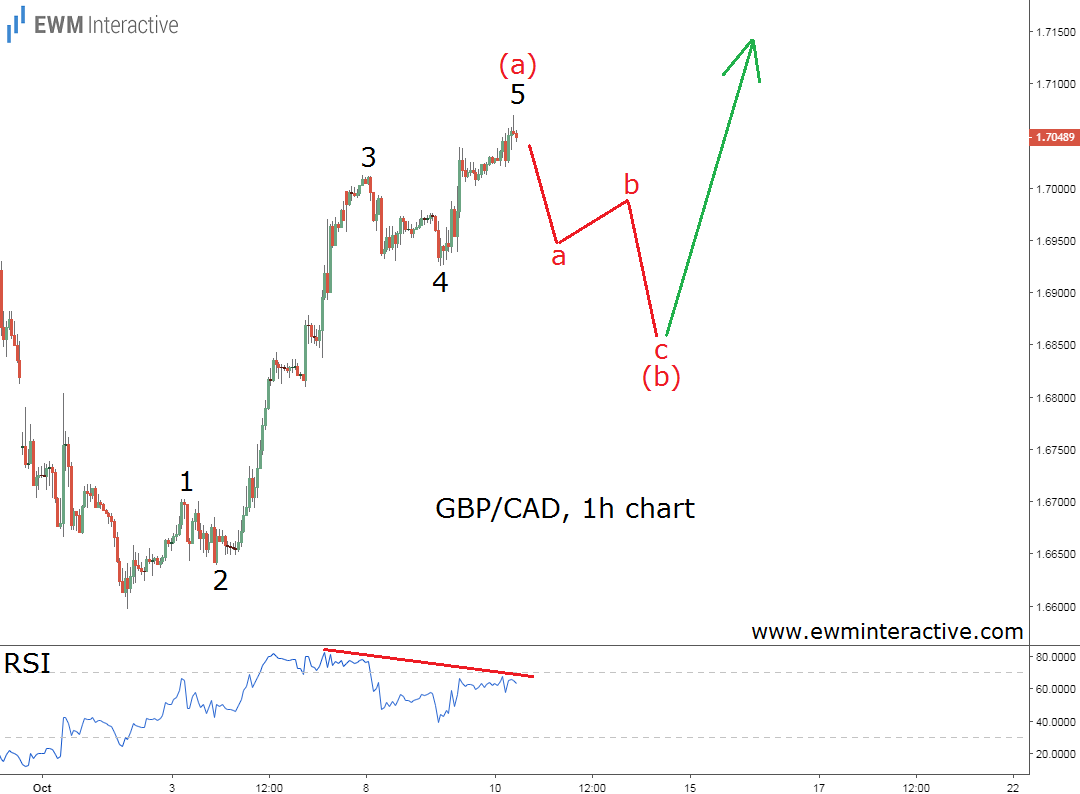
October is shaping up to be a good month for GBP/CAD bulls. The pair dipped below 1.6600 on October 2nd, but quickly reversed to the upside for a recovery of over 470 pips so far. Earlier today the Pound climbed to as high as 1.7070 against the Canadian dollar.
However, extrapolating the current trend into the future is not a good strategy, especially in the Forex market. Just because GBP/CAD has been rising recently does not mean traders should rely blindly on the bulls to take it even higher.
What are the waves saying about GBP/CAD?
In order to find out what lies ahead, let’s examine the pair’s recent progress through the prism of the Elliott Wave Principle. The hourly chart below will help us with that task.
As visible, GBP/CAD’s recovery from 1.6597 to 1.7070 has taken the shape of a textbook five-wave impulse, labeled 1-2-3-4-5 in wave (a). Overall, this pattern brings good news for the bulls. It suggests the larger sequence is still headed north. On the other hand, the theory states that a three-wave correction follows every impulse. A healthy pullback in wave (b) at least back to the support area of wave 4 near 1.6900 can be expected before the rally continues.
In addition, there is a strong bearish divergence between waves 3 and 5, visible on the chart of the RSI indicator. It tells us that even though GBP/CAD has been making new highs, the force behind it is fading.
To conclude, GBP/CAD had a good run lately, but the Elliott Wave principle suggests a pullback to 1.6900 or even 1.6800 is due now. Better long entries should present themselves as wave (b) down develops. As long as the starting point of the impulse at 1.6597 holds, this is the count to rely on.
