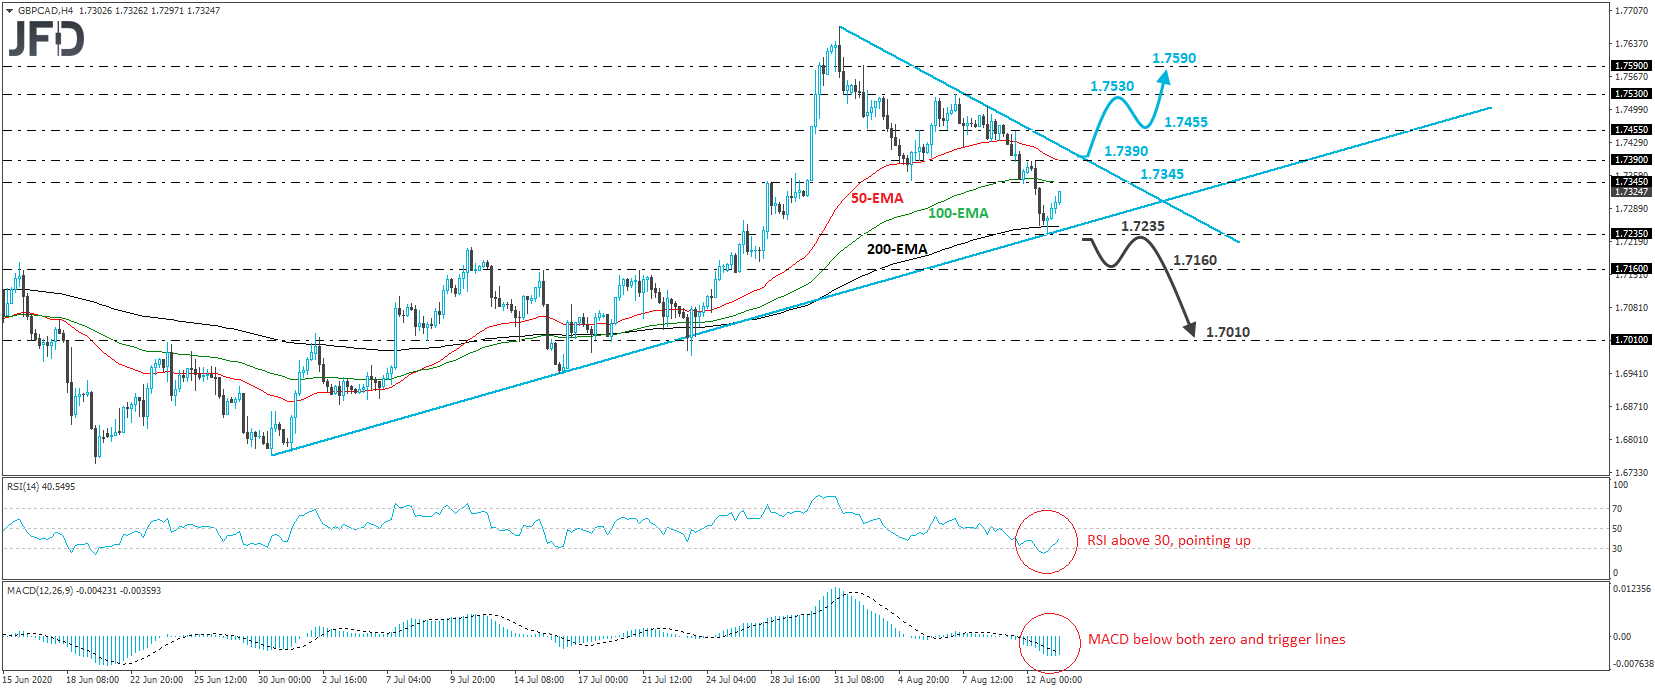
GBP/CAD traded higher on Thursday, after it hit support near the crossroads of the 1.7235 level and the upside support line drawn from the low of June 30th. This suggests that there are decent chances for the recovery to continue for a while more, but bearing in mind that the rate is also trading below a newly established downside resistance line taken from the high of July 31st, we will take a flat approach for now.
In order to get confident on a larger recovery, we would like to see a break above the 1.7390 level, marked as a resistance by yesterday’s high. This move would also take the rate above the aforementioned downside line and may initially aim for the 1.7455 level, the break of which could pave the way towards the peak of August 7th, at around 1.7530. If that level fails to throw the bulls out of the field, a break higher may set the stage for extensions towards the 1.7590 zone, near the high of August 3rd.
Taking a look at our short-term oscillators, we see that the RSI exited its below-30 zone and is now pointing up, while the MACD, although below both its zero and trigger lines, shows signs of bottoming as well. Both indicators suggest that the downside momentum is dissipating, but the fact that they are both still below their equilibrium lines enhances our choice to wait for a move above 1.7390 before we consider larger advances.
On the downside, we would like to see a dip below yesterday’s low of 1.7235 before we assess whether the outlook has turned bearish. Such a slide will also drive the pair below the upside line taken from the low of June 30th, and may encourage the bears to target the 1.7160 zone, defined as a support by the inside swing highs of July 15th and 21st. If they are strong enough to overcome that zone as well, then we may see larger declines, perhaps towards the 1.7010 zone, which acted as a decent support between July 17th, and 23rd.