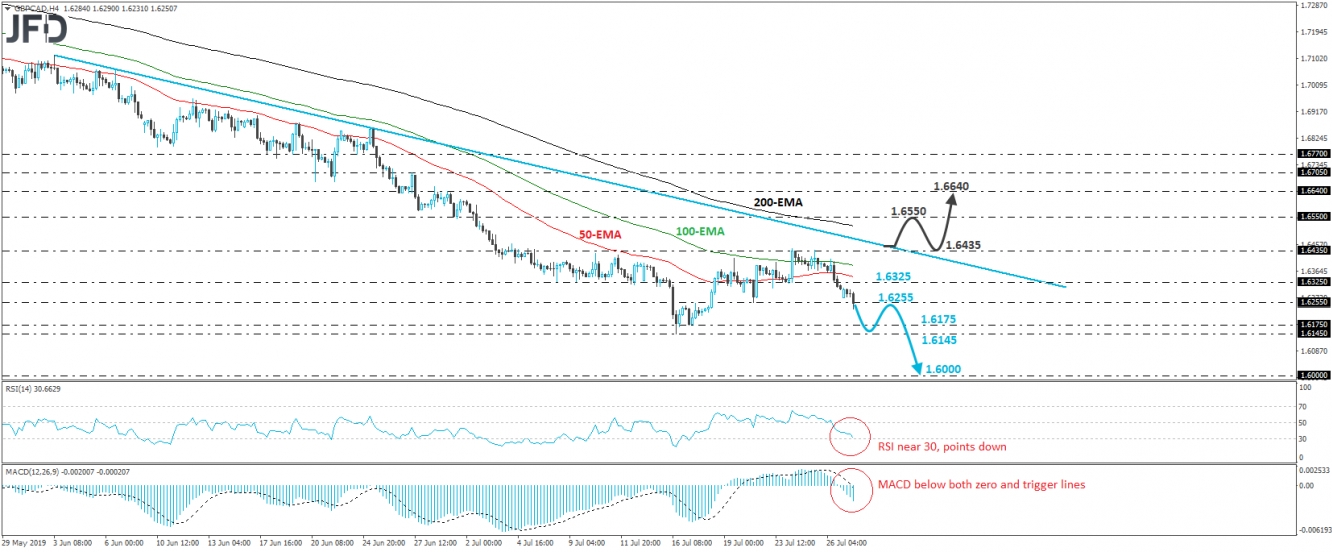
GBP/CAD entered a sliding mode on Thursday, after it hit resistance at 1.6435. The tumble continued on Friday and today as well, with the rate currently trading slightly below the 1.6255 barrier, which is marked by the low of July 22nd, as well as by the inside swing high of July 17th. Overall, the rate continues to trade below the downside resistance line drawn from the high of June 3rd, which combined with the aforementioned slide suggests that further declines may be in the works.
If the bears are willing to stay in the driver’s seat, we could see them aiming for the 1.6175 level soon, or the 1.6145 barrier, defined by the low of July 16th. However, before we get confident on larger declines, we would like to see a clear dip below the latter level. Such a dip could see scope for extensions towards the psychological round number of 1.6000, which is also defined as a support by the low of September 14th, 2017.
Taking a look at our short-term oscillators, we see that the RSI moved lower and is now approaching its 30 line, while the MACD lies below both its zero and trigger lines, pointing down as well. Both indicators detect negative momentum and support the notion for this exchange rate to continue drifting south for a while more.
In order to abandon the bearish case and start examining whether the near-term outlook has turned positive, we would like to see a decent recovery above the 1.6435 resistance, as well as above the pre-discussed downside resistance line. Such a move would confirm a forthcoming higher high on both the daily and 4-hour charts and may encourage the bulls to pull the trigger for the 1.6550 zone, marked by the inside swing low of July 1st. Another break, above 1.6550, may extend the advance towards the peak of the same day, which is at around 1.6640.

