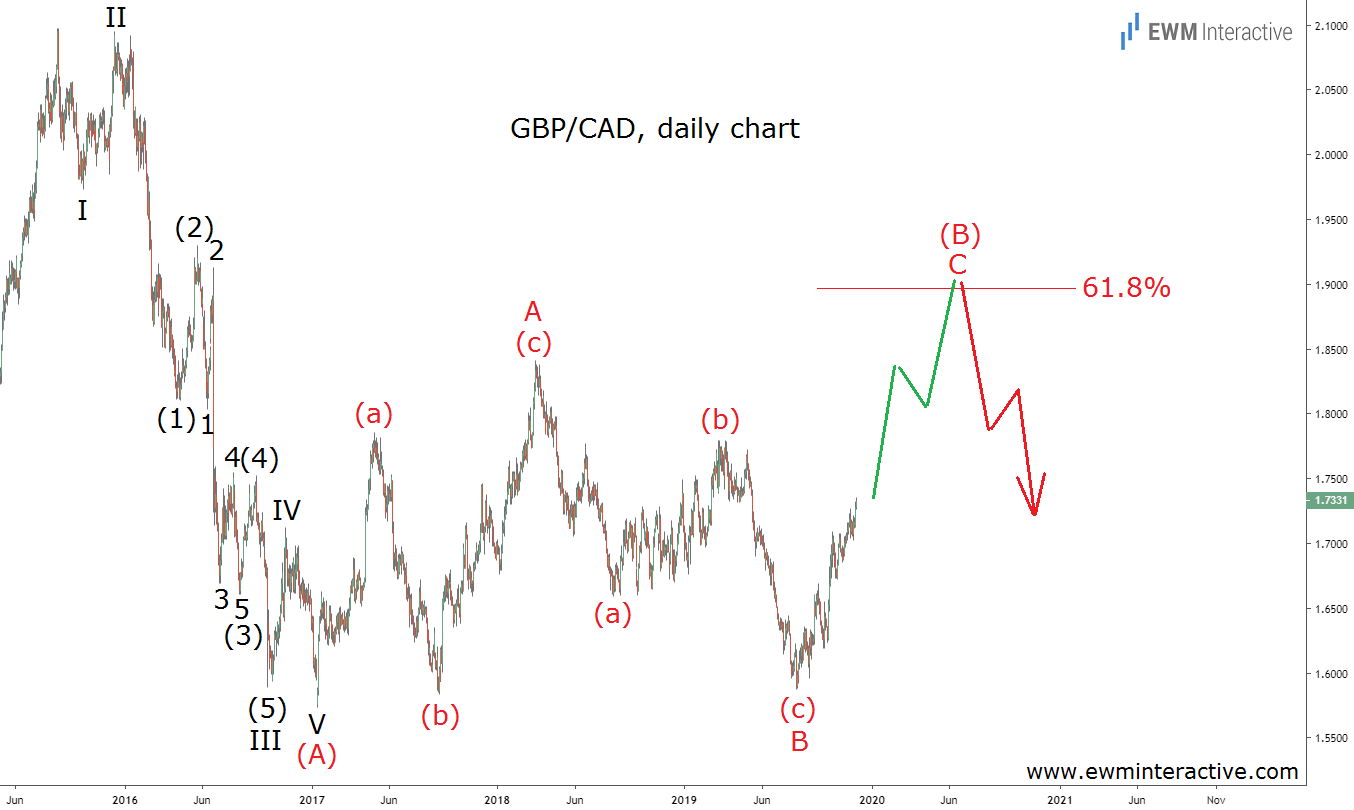
GBP/CAD bulls have been on a roll the past four months. The pair is currently trading above 1.7330, up 9.1% from its early-August low of 1.5875. And while the Forex market is not the place to rely on a trend for very long, it is not uncommon for GBP/CAD to make large moves in either direction.

So let’s take a look at the pair’s daily chart below from an Elliott Wave point of view. It will allow us to make sense of the recent recovery by putting it into the bigger picture context.
The daily chart of GBP/CAD visualizes the pair’s entire development since the top at 2.0972 in August 2015. The decline to 1.5736 by January 2017 is a five-wave impulse pattern. It is labeled I-II-III-IV-V, where the sub-waves of waves III and (3) of III are also visible.
GBP/CAD to Add Another 1700 Pips
Impulses point in the direction of the larger trend, which means more weakness can eventually be expected in GBP/CAD. On the other hand, a three-wave correction follows every impulse. That is what we believe has been in progress for the past three years.
Initially, there was a very distinctive three-wave recovery up to 1.8416 by March 2018. The corrective phase of the 5-3 wave cycle could have ended there, but the following decline failed to breach 1.5736. This most likely means GBP/CAD is now drawing a bigger A-B-C flat correction.
If that is the case, the current rally from 1.5875 must be part of wave C. It is supposed to exceed the top of wave A, meaning targets above 1.8416 are plausible in the months ahead. Once there, the 61.8% Fibonacci level near 1.9000 is going to be within the bulls’ reach, as well. A bearish reversal in that area for the beginning of wave (C) down would make sense.
