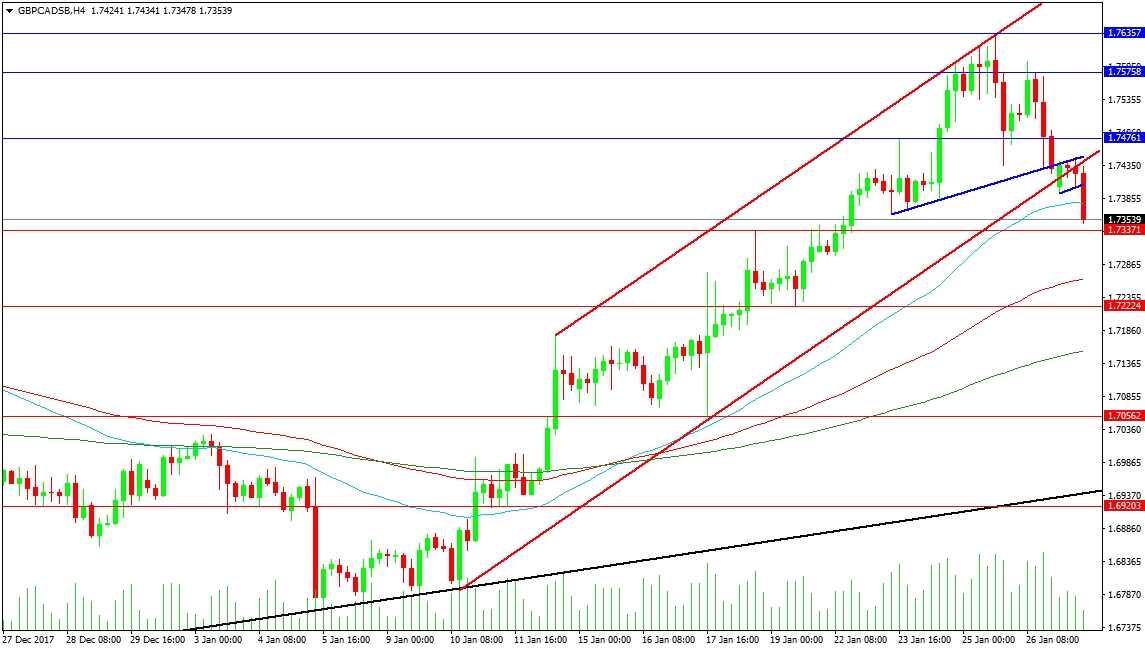
The GBP/CAD pair has been rising steadily since its break above 1.70500 in early January but today it dropped back under trend line support. It reached a peak of 1.76357 on Thursday. The blue rising trend line managed to hold as support on the initial series of tests but gave way late on Friday. This, in turn, led to a test of the red rising support trend line for January. The market chose to test this around 1.74250 by forming a bear flag across the trend line. The flag broke this morning at 1.74050 and by the time of writing, we have reached a low of 1.73478. Resistance above is at the crossing point of the trend lines around 1.74500 and also the 1.75758 level. Ultimate resistance can be found at the channel top.
Support below current price levels can be found at 1.73000 followed by the 100-period MA at 1.72636. There is old resistance turned support at 1.72224 and 1.70562. The 200-period MA is found at 1.71545 with a rising support trend line shown in black at 1.69390.
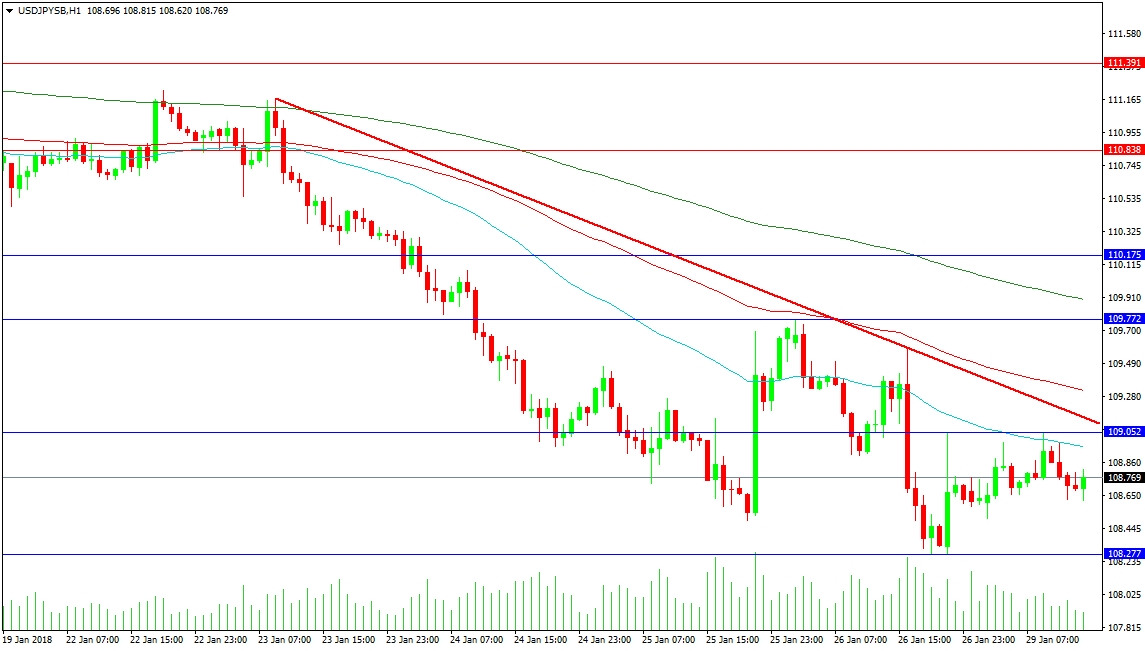
This pair has continued its decline despite having a counter-trend day on Thursday when price retested resistance at 109.700. On Friday, BOJ Governor Kuroda made comments while speaking at Davos that led to a move to fresh lows for the week and month at 108.277. Today, we are holding above those lows but have retested and held resistance at 109.052. These moves have set up a trading range between these levels.
Should the market attempt to move higher, it first needs to overcome the falling red trend line at 109.145 and the 100-Hour MA following close behind it at 109.320. Only then can it hope to test Thursday’s high at 109.772 and the 200-Hour MA at 109.900. The major resistance at 110.000 can be used as a ceiling but if the price moves above it once again the pair can rally hard in a counter-trend move forcing short traders to close positions as we saw in September 2017. This would mean a move towards resistance around 111.000.


