It’s probably fair to say that the British pound exceeded expectations of many in 2017. By the close of the year, GBP had rallied 9.53% against the flailing greenback, 7.4% against NZD and 5.6% against JPY. Yet whilst these are admirable results from a currency which was poised to only go lower (thanks to Brexit) we have now witnessed a momentum shift against commodity currencies since the beginning of December.
A few things occurred around this time which favoured commodity currencies: CAD was supported by the BOC hike and strong hint that less stimulus may be required (Strong PMI’s and housing builds also did their bit of course); AUD was domestically bolstered by firm employment data; NZD experienced short covering as the ‘market friendly’ Adrian Orr was named as the next RBNZ Governor. All three were supported by higher commodity prices and a weaker greenback.
Unfortunately for sterling, traders have found less reason to buy GBP without a fresh catalyst. As GBP has depreciated against AUD the most compared to CAD and NZD since the beginning of December, we’re on the lookout for a short opportunity on GBP/AUD. That is not to say opportunities may not present themselves on GBP/NZD or GBP/CAD though, but relative strength and trend analysis currently favour GBP/AUD shorts.

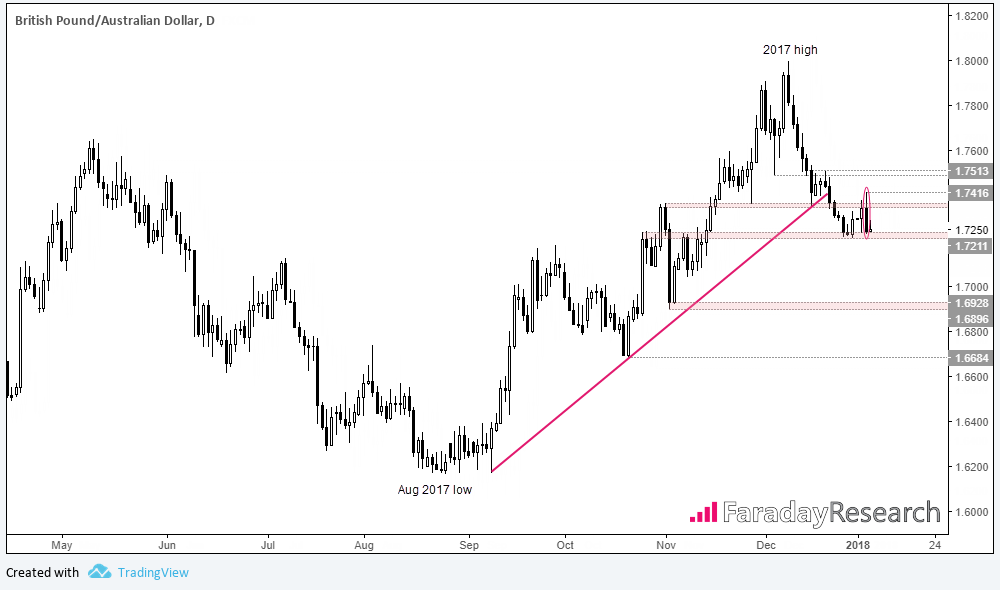
Looking at the daily chart of GBP/AUD we can see it was the 8th December when the 2017 high formed at 1.7997. This was its last hurrah of the year as a momentum shift took-place and losses began to unfold. Over the subsequent 13 session only two minor up-days were seen as part of a shallow pullback, which merely served as a minor pause prior before breaking the August trendline. By the end of the mini-rout on day 13, GBP/AUD had shed -4.4% and support was found at 1.7211. Will this level continue to hold as support? Recent price action begs to differ.
Following a relatively small pullback to 1.7416, yesterday’s bearish engulfing candle suggests a swing high may have formed, or at the very least is making an attempt of one. What makes this candle of more interest is how the session opened just beneath a resistance zone and an attempted rally above it failed to hold, before rolling over as a mini bull-trap. That is also closed at the low of the session and its range was outside the prior days’ also further highlights the bearishness of this one session.
So our attention now shifts to 1.7211, as a break beneath the December low opens up a potential run for 1.6896-928. This is also where patience becomes a virtue. As the bearish engulfing candle was the widest ranging day in 7 session, there is the risk that the subsequent candle may not be as volatile, or even retrace following a break lower. So perhaps a preferable outcome is for prices to stabilise above 1.7211 before providing a decisive break lower, where we’ll then seek a trade entrance in the form of price compression or low volatility retracement.
