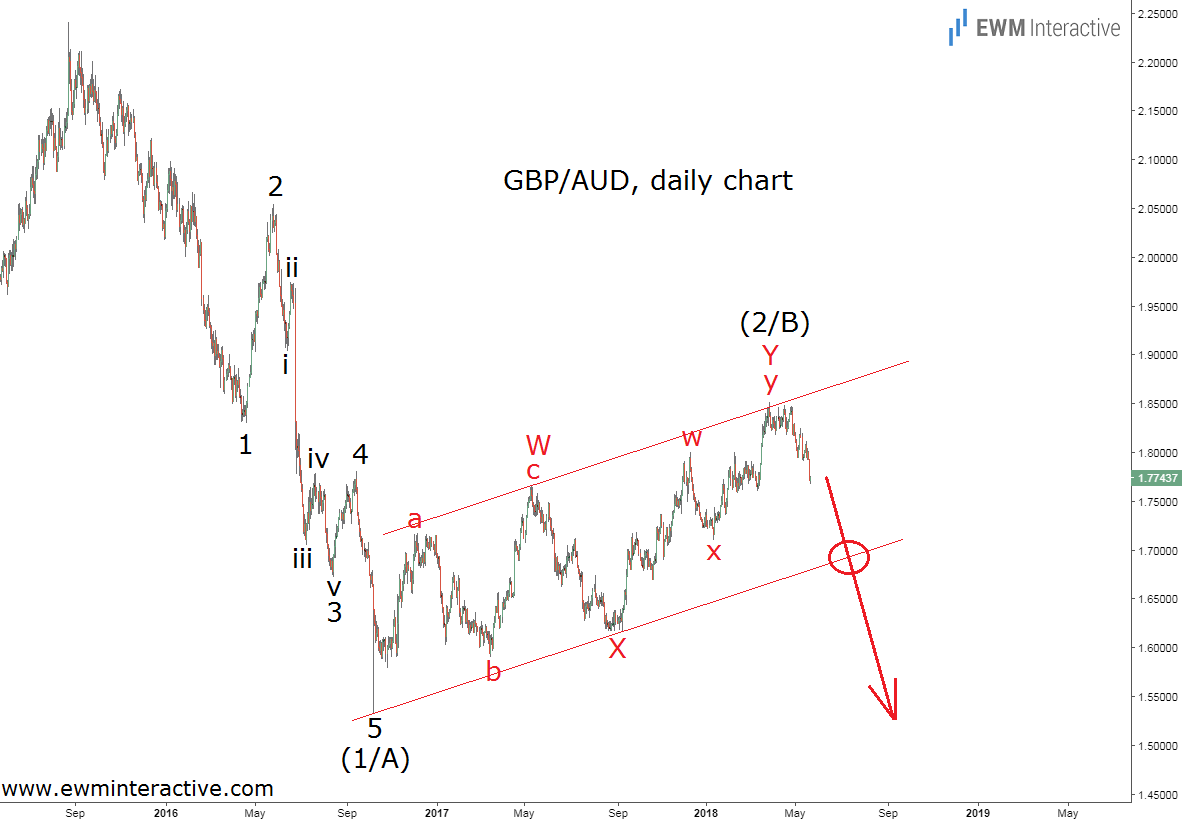
If you take a look at how GBP/AUD has been doing between October 2016 and March 2018 you might think Brexit never happened. The British pound rallied from as low as 1.5322 to 1.8509 against the Australian dollar, gaining almost 21% in those 18 months. As of this writing, the pair is hovering around 1.7720, but is this just a short-term dip that should be viewed as a buying opportunity or the beginning of a bigger selloff the bulls are not prepared for? The Elliott Wave analysis of the daily chart of GBP/AUD helps us find the answer to this question.

It allows us to take a step back and see the structure of the price development since the top at 2.2405 registered in August 2015. The decline to 1.5322 is a textbook five-wave impulse, where the sub-waves of wave 3 are also clearly visible. According to the theory, every impulse is followed by a correction of three waves in the other direction, so naturally, once wave 5 of (1/A) was over it was time for a significant recovery in wave (2/B). That is what we believe has been in progress between 1.5322 and 1.8509. Wave (2/B) took the shape of a corrective combination between a simple a-b-c zigzag in wave W and a w-x-y double zigzag in wave Y. The corrective pattern has been developing within the parallel lines of a channel, whose upper line was strong enough to discourage the bulls and put pressure on GBP/AUD again.
If this count is correct, there is a 5-3 wave cycle pointing to the south on the daily chart of GBP/AUD, which suggests another major selloff in wave (3/C) should be expected from now on. The odds are heavily in the bears’ favor, giving them a good chance to drag the pair down to a new multi-year low and breach 1.5300. The last time GBP/AUD traded below this figure was five years ago – in May 2013.
