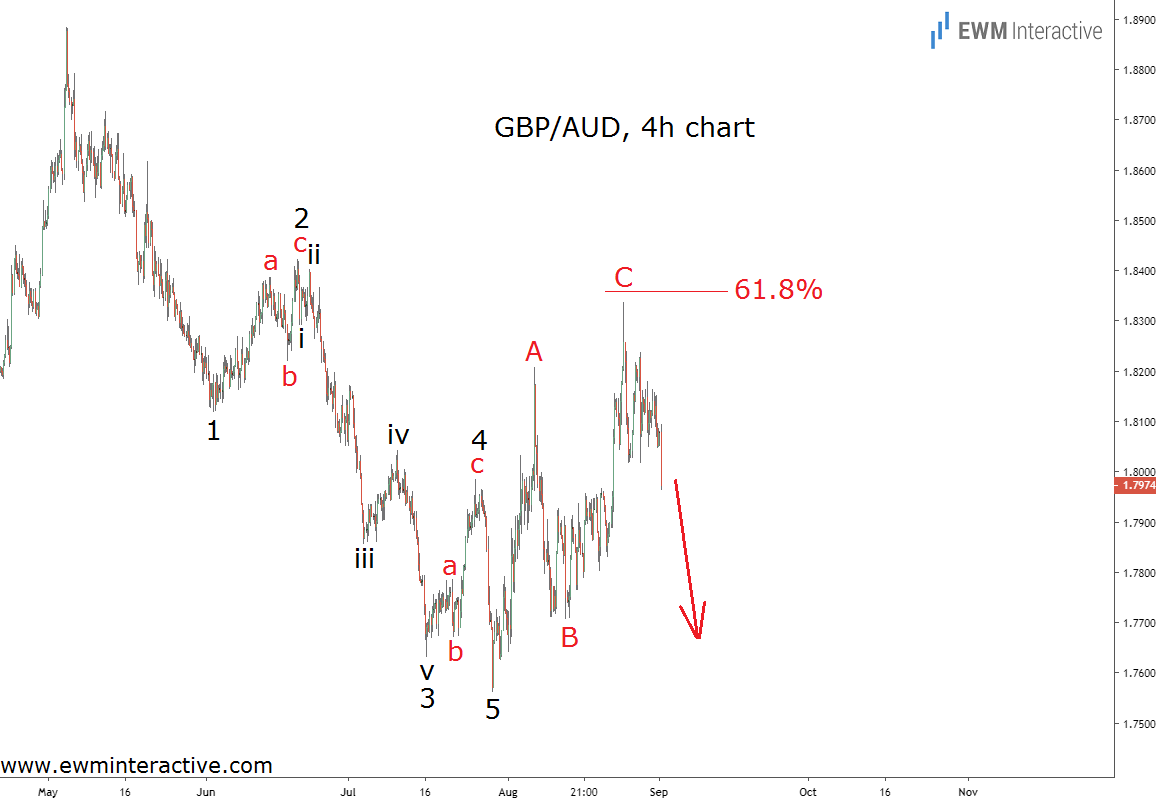
Between July 30th and August 26th, GBP/AUD managed to recover from 1.7561 to 1.8337. Despite the no-deal Brexit prospects, the Australian dollar turned out to be even weaker than its British rival for almost a month.

However, GBP/AUD is down by roughly 400 pips since August 26th. Traders are probably wondering if this is a buy-the-dip opportunity or the beginning of a larger selloff. We are wondering, too, so let’s examine the situation through the prism of the Elliott Wave principle.
The 4-hour chart of GBP/AUD reveals not only the recovery from 1.7561, but also the preceding decline from 1.8884. As visible, it is a five-wave impulse pattern, labeled 1-2-3-4-5. The five sub-waves of wave 3 can be recognized, as well.
According to the Elliott Wave theory, a three-wave correction follows every impulse. This means the recovery to 1.8337 by late-August is hardly the start of a new uptrend. Instead, it is most likely a simple A-B-C zigzag correction within the larger downtrend from 1.8884.
Note how the 61.8% Fibonacci level discouraged the bulls in wave C. This is another indication that the entire 5-3 wave cycle is complete. If this count is correct, we can expect the trend to resume in the direction of the impulsive sequence. Targets below 1.7560 make sense for GBPAUD going forward.
