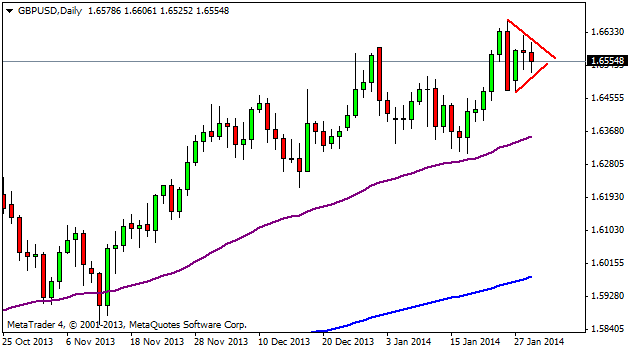
The GBP/USD has been in a range between the 1.6460 and the 1.6633. This range has been shrinking more and more during the last few days, creating on the chart what we call a Symmetrical Triangle. It is called a symmetrical triangle because the price starts making lower highs and higher lows, creating two trendlines that when extended form a triangle. This chart pattern is considered to be a consolidation pattern where prices can break out in any direction, but if the trend coming into the formation is bullish, then there is a higher probability of prices breaking to the upside, but we cannot bet the house on that, because it can also break to the downside. The best thing to do is to wait for the breakout and then the pullback for an entry in the direction of the breakout.
 GBP/USD: Daily" title="GBP/USD: Daily" align="bottom" border="0" height="242" width="474">
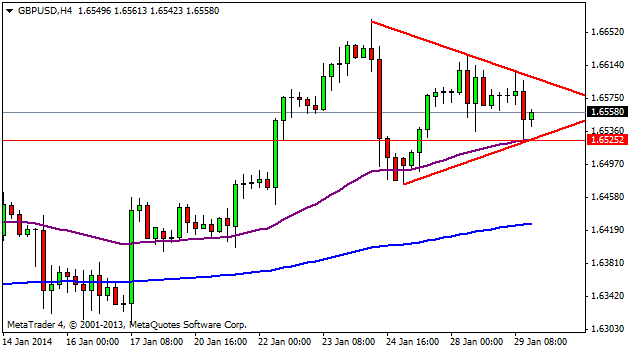
On the 4 hour chart, we can see in better detail the formation of the Symmetrical Triangle. We can also notice that at the lower part of the range, we have the 55 EMA (purple line) which has been acting as a very good support level, around the 1.6525. We can use this area as an entry point in case we see a breakout to the downside of this zone and then the pullback to it. To the upside, we can use the upper trendline as our entry level if it is broken to the upside.
 GBP/USD: 4-Hour" title="GBP/USD: 4-Hour" height="242" width="474">
Author: Alexander Londono – Financial Analyst at Optionova
