
Our approach to trading could be categorised as trend followers, as in we like to trade in the direction of the prevailing dominant trend. The reason we believe in trading in the direction of the longer term trend is simply because trending price action offers the highest probability of success.
However, there are occasions; very specific circumstances when the right trade is actually counter the dominant trend. I know this sounds very contradictory, but I hope by the end of this blog you’ll see that this type of trade can be very profitable.
As a trend follower the bias is to buy or sell when price action breaches key levels. The thinking behind this strategy is that stops are placed behind major levels, so breaking one of these levels can lead to momentum moves. However, this does always pan out as we’d expect, and in fact price ends up reversing aggressively in the opposite direction. This happened today, and we profited from it.
GBP/USD is in LONG term range bound market capped by lower support at 1.5270 key level, and upper resistance on the 1.6300 key levels. Price has failed to forge a sustained break of these since July 2010. That’s a pretty long time, right? Have a look at the weekly chart.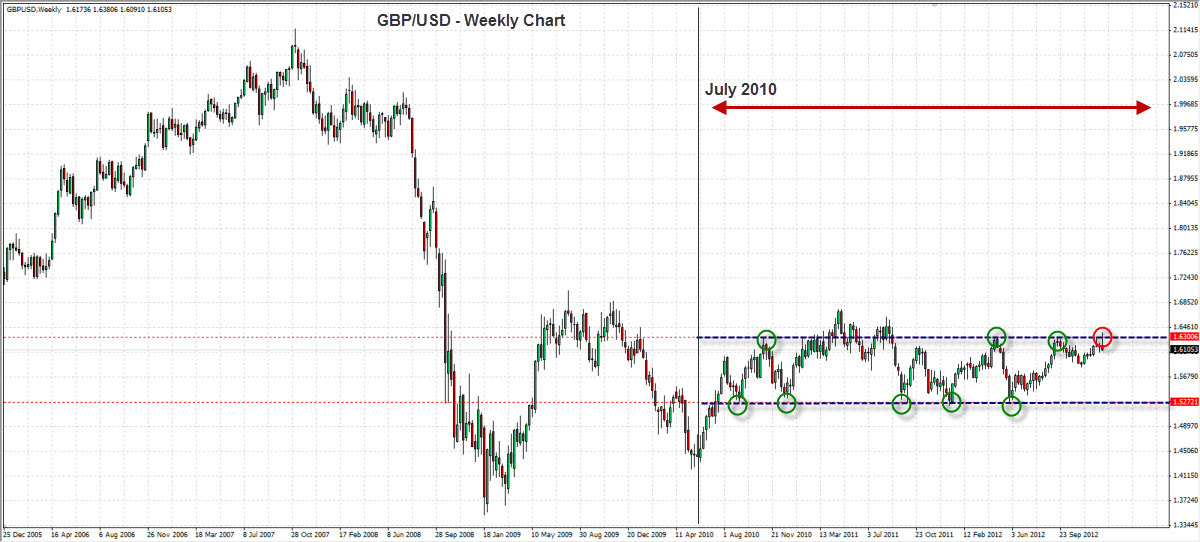 GBP/USD Weekly Chart" title="GBP/USD Weekly Chart" width="600" height="575">
Price action on the daily chart shows the most recent rally from the lower support up to resistance at 1.6300. As price approaches this level trend followers are seeing a technical uptrend, and will be eager to add on the break of the 1.6300 key level.
We however have put price in to context and know that the 1.6300 handle has acted as major resistance on numerous occasions. Traders will need a strong reason the force cable higher, and with no fundamental driver this looked highly unlikely. So, we took a position in the opposite direction to the recent trend.
We watched price breach the 1.6300 handle yesterday. Cable bulls buying through this level were anticipating the execution of buy stops and a momentum move higher. If this happened, then no problem, we miss out on this occasion. As price action unfolds sellers enter the market and drive price lower, back below the 1.6300 handle. Now we’re on the lookout for shorts.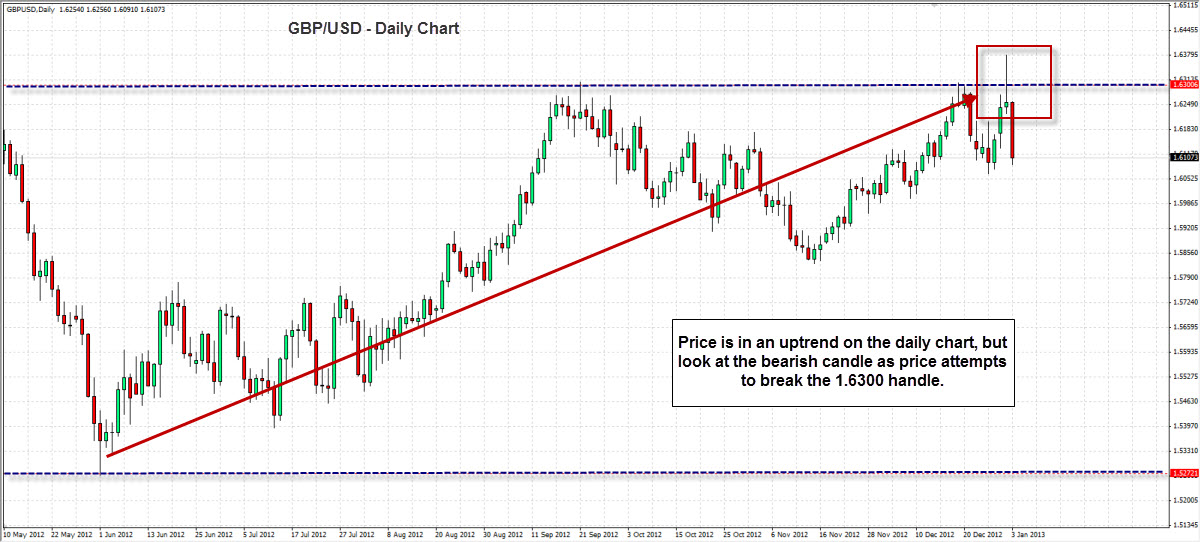 GBP/USD Daily Chart" title="GBP/USD Daily Chart" width="600" height="575">
Cable sets a fresh daily low at 1.6220, but close slightly above this level. Now we’re looking for price to fall below the daily low to confirm the bears are in control. Entry is on the break of the 1.6220 level. Stop above the swing high above resistance at 1.6300. Profit target 1:1.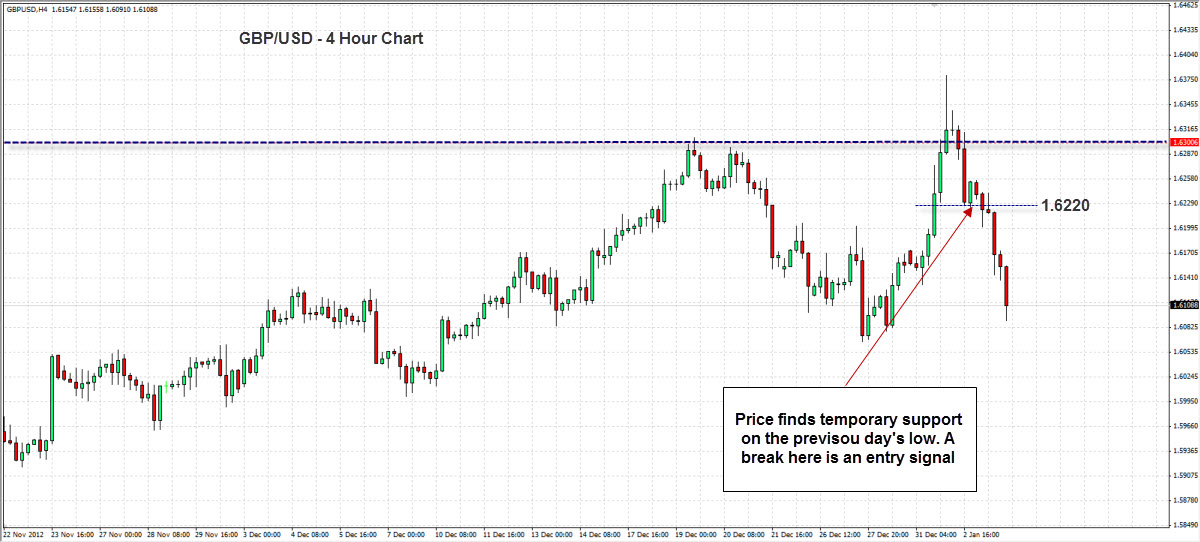 GBP/USD - 4 Hour Chart" title="GBP/USD - 4 Hour Chart" width="600" height="575">
- English (UK)
- English (India)
- English (Canada)
- English (Australia)
- English (South Africa)
- English (Philippines)
- English (Nigeria)
- Deutsch
- Español (España)
- Español (México)
- Français
- Italiano
- Nederlands
- Português (Portugal)
- Polski
- Português (Brasil)
- Русский
- Türkçe
- العربية
- Ελληνικά
- Svenska
- Suomi
- עברית
- 日本語
- 한국어
- 简体中文
- 繁體中文
- Bahasa Indonesia
- Bahasa Melayu
- ไทย
- Tiếng Việt
- हिंदी
GBP/USD: The Failure Trade
Published 01/04/2013, 02:35 AM
Updated 07/09/2023, 06:31 AM
GBP/USD: The Failure Trade
Latest comments
Loading next article…
Install Our App
Risk Disclosure: Trading in financial instruments and/or cryptocurrencies involves high risks including the risk of losing some, or all, of your investment amount, and may not be suitable for all investors. Prices of cryptocurrencies are extremely volatile and may be affected by external factors such as financial, regulatory or political events. Trading on margin increases the financial risks.
Before deciding to trade in financial instrument or cryptocurrencies you should be fully informed of the risks and costs associated with trading the financial markets, carefully consider your investment objectives, level of experience, and risk appetite, and seek professional advice where needed.
Fusion Media would like to remind you that the data contained in this website is not necessarily real-time nor accurate. The data and prices on the website are not necessarily provided by any market or exchange, but may be provided by market makers, and so prices may not be accurate and may differ from the actual price at any given market, meaning prices are indicative and not appropriate for trading purposes. Fusion Media and any provider of the data contained in this website will not accept liability for any loss or damage as a result of your trading, or your reliance on the information contained within this website.
It is prohibited to use, store, reproduce, display, modify, transmit or distribute the data contained in this website without the explicit prior written permission of Fusion Media and/or the data provider. All intellectual property rights are reserved by the providers and/or the exchange providing the data contained in this website.
Fusion Media may be compensated by the advertisers that appear on the website, based on your interaction with the advertisements or advertisers.
© 2007-2024 - Fusion Media Limited. All Rights Reserved.