A few weeks back I suggested in a rather long-winded post that GBP/USD was possibly on the verge of a move to 1.7000, or at least the high 1.6000s. Its been a frustrating trade in that time, as cable lived up to its name of 'the widowmaker', a term we affectionately gave it on an FX desk I used to work on. For those of you with the inclinations, that post can be seen here.
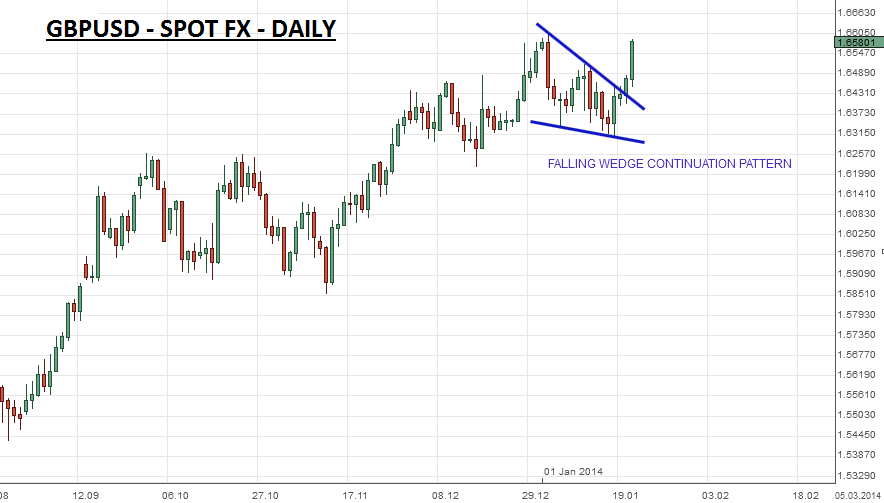
Today's price action has however suggested that the bull move first alluded to in that post may be back on. The price action today, in the wake of very strong UK data, has seen the breakout of a classic 'Bullish Falling Wedge' pattern, one of my favourite trading patterns, this suggests further gains may lie ahead int he coming weeks if not days.
 GBP/USD" title="GBP/USD" align="bottom" border="0" height="242" width="474">
Some resistance may occur at the old high from December at 1.6603, but a move clear of that would strongly favour continued gains, possibly to around 1.7000, with any move back below today's 1.6450 low, suggesting a pattern failure. Longer-term, I'm not to sure, I'd like to see how it performs around the 1.7000 area if it gets there, though currently I favour the idea of a failure around there and eventually lower levels.
