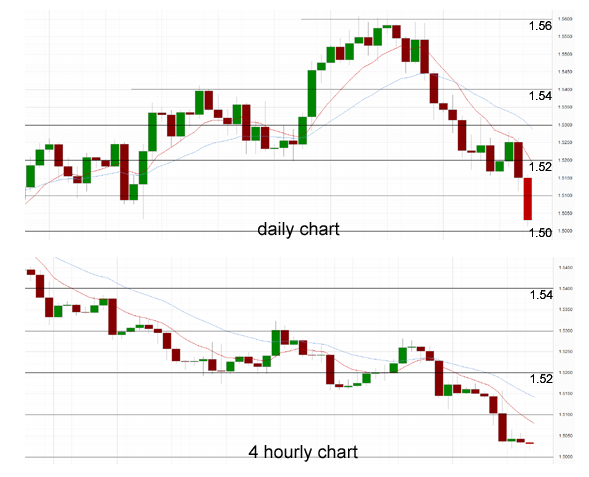
Over the last 48 hours the GBP/USD has reversed again and fallen strongly to a new two month low close to 1.50, after enjoying a reasonable rally for a couple of days beforehand. For a few days it found some support around 1.5160 however the last 24 hours has seen a sharp drop and smash through a couple of support levels. This has resulted in seeing the pound at levels not seen since early March. The pound has now experienced a strong fall over the last couple of weeks. Prior to the last couple of weeks, the pound enjoyed a strong couple of weeks and move to new highs above 1.56. It experienced all sorts of bother at 1.56 as it made several pushes to this significant level however it was turned away with excessive supply. For about a week it ran into a wall of resistance right around the 1.56 level. This showed how much buying pressure there was on the 1.56 level but equally how well that level provided resistance to any movement higher. The pound had enjoyed a very solid couple of weeks moving from the support level at 1.52 to reach new highs at 1.56, a new ten week high.
Back around mid April the pound experienced solid support at 1.52 for about a week which greatly assisted the recent surge higher, and now this level is being called upon again to offer some support and a soft landing, although the pound has drifted a little lower than 1.52 now. Towards the end of last week, we saw some evidence of that as the decline had been slowed down halted, although it has fallen slightly lower since. The last couple of weeks has seen the pound fall strongly and return almost all of its gains from the few weeks before that. About a month ago the 1.54 level provided a little piece of resistance and this level has since been broken as it offered limited support. Now that the pound has drifted back down below 1.54, it may provide some resistance again. During its push to 1.56, the pound was able to find some support at 1.55, although this level was also broken a couple of weeks ago.
Over the last month or so, the GBP/USD has been experiencing a variety of different levels which have played a role on the price action. Towards the end of March the GBP/USD was trading within a range roughly between 1.51 and 1.5250 and now on a couple of occasions it has been able to move outside that range and push higher. A few weeks ago, the 1.5350 level was one of significance as it offered resistance before the GBP/USD was able to move higher through to 1.56. In early March the pound moved to new lows around 1.4830 from a starting point near 1.64 at the beginning of the year. With the surge higher over the last couple of months, the GBP/USD had completely turned around its fortunes from earlier in the year, however it is starting to ease off and return most of the good work.
In the UK, another weak key release meant more bad news for the struggling pound. Retail Sales posted a decline of 1.3%, way off the estimate of 0.0%. It was the second straight decline for the key indicator, and its lowest reading since last May. There were no surprises as the Bank of England released the minutes of its recent policy meeting, which showed a unanimous vote to maintain the interest rate, while there was a split with regard to quantitative easing, as three of the nine MPC members voted to increase QE. The pound has had a disastrous month of May, and the downward slide shows no sign of letting up. The British currency has now shed about four cents against the dollar since the beginning of the month and if market sentiment continues to be negative, we could soon see the pound test the all-important 1.50 level.
GBP/USD May 23 at 04:30 GMT 1.5029 H: 1.5157 L: 1.5014 GBP/USD Technical" title="GBP/USD Technical" width="596" height="81">
During the early hours of the Asian trading session on Thursday, the GBP/USD is consolidating in a very narrow trading range right around 1.5040 after having recently moved down to a new two month low near 1.50. Throughout the first part of this year, the pound fell very strongly from the key resistance level at 1.63 level down to levels not seen in two and a half years and has done well the last month to rally well and move back up above 1.56. Current range: Right around 1.5030.
Further levels in both directions:
• Below: 1.5000.
• Above: 1.5300 and 1.5600.
(Shows the ratio of long vs. short positions held for the GBP/USD among all OANDA clients. The left percentage (blue) shows long positions; the right percentage (orange) shows short positions.)
The GBP/USD long positions ratio has moved back up above 50% after the GBP/USD has fallen down to the two month low near 1.50. Trader sentiment remains in favour of long positions.
Economic Releases
- 07:58 EU Flash Composite PMI (May)
- 07:58 EU Flash Manufacturing PMI (May)
- 07:58 EU Flash Services PMI (May)
- 08:30 UK GDP (2nd Est.) (Q1)
- 08:30 UK Retail Sales (Apr)
- 08:30 UK Index of Services (Mar)
- 12:30 US Initial Claims (17/05/2013)
- 12:58 US Flash Manufacturing PMI (May)
- 13:00 US FHFA House Price Index (Mar)
- 14:00 EU Flash Consumer Sentiment (May)
- 14:00 US New Home Sales (Apr)