GBP/USD – Hitting the 20ema After SDB Pattern
After selling off a decent chunk last week, the cable is formed an SDB pattern (Shortened Double Bottom) with the lows of both 4hr candles hitting within 1 pip of each other, which gave us a clear line in the sand telling us there were some solid buyers there willing to defend that area and get long despite the last 28 out of 32hrs of selling as you can see in the 4hr chart below. These patterns on higher time frames generally offer another price action trigger on a lower time frame. Shifting to the 1hr chart, we can see this is exactly how it played out, forming a pinbar which was the beginning of the engulfing bar (2nd bar of SDB pattern) from the 4hr chart above.
Many of our price action traders got in this one, myself included and have already locked in profit along with neutralizing all the risk. Targets are set for 1.5896 which is a key SL (Swing Low) which you can see in the first chart. Should price clear this level, then we could be seeing a test of the 1.5950 prior highs. Price for now is forming a bull flag near the highs for the day suggesting likely continuation from here if it can clear the 20ema on the 4hr charts.\\\\\
USD/JPY – Forms Inside Bar at Top of Range
After climbing the last two out of three days, the USDJPY formed an inside bar which also is moonlighting as a pinbar as well. The tricky thing about this formation is the inside bar is almost the same range as the prior bar, thus in effect, making this a two-bar trading range. Traders should wait for a break on either side of the A bar (labeled in chart) before taking any new positions. A break of the high suggests trend continuation while a break of the A bars low suggests to sub 80.50 and possibly the 20ema parked at the 80 big figure.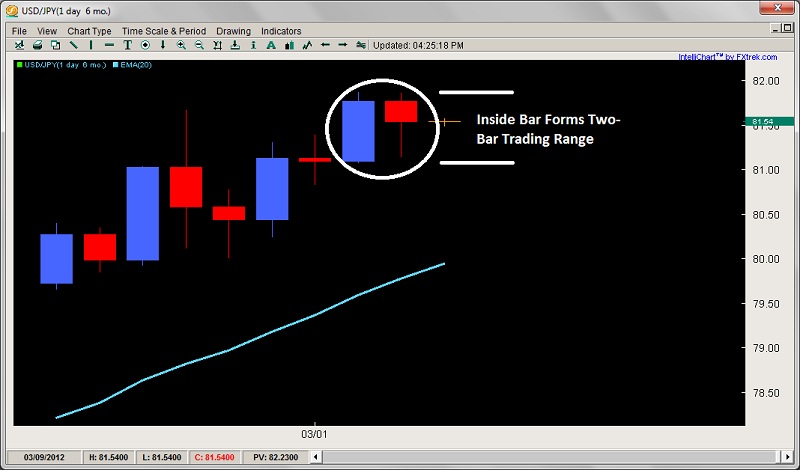 USD/JPY" title="USD/JPY" width="800" height="470" />